CML stands for Central Meridian Longitude. Just as Earth is divided into lines of longitude and latitude, so too is Jupiter. Remember that lines of longitude are the lines extending from the north to south pole and lines of latitude are the lines running parallel to the equator. CML helps observers tell which part of the planet is facing Earth during an observation.
The system now used by astronomers in determining Jupiter's longitude is known as System III. This system uses the magnetic field of Jupiter as opposed to the visible cloud tops used in the previous system. The reason for using the magnetic field of Jupiter instead of the visible cloud tops is that the magnetic field is controlled by the interior of the planet. The motion of the interior of the planet is constant and gives the true rotation rate as opposed to the measuring the rotation rates of cloud bands which change with latitude.
Where does Io fit in?
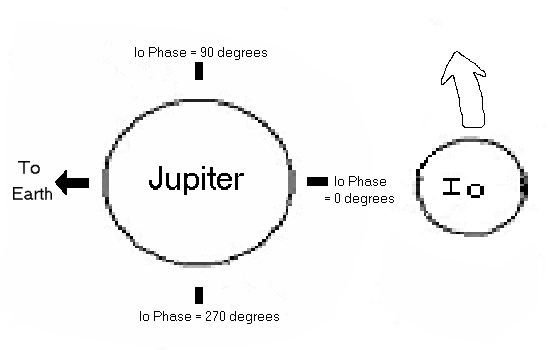
Io is Jupiter's innermost moon. The position of Io relative to Jupiter has an effect on the occurrence of radio storms. When Io is at certain positions in its orbit around Jupiter the probability of a storm occurring is much greater. The position of Io in its orbit relative to an observer is referred to as the phase of Io. When Io is directly behind Jupiter, as viewed from Earth, the phase is said to be zero. If you were looking down from over the north pole of Jupiter onto Io you would see that Io revolves counterclockwise. It takes Io almost two days to revolve around Jupiter. As Io orbits, its phase increases with 180 degrees being directly in front of Jupiter, as seen from Earth. The Io phase continues increasing until Io returns back to its original position

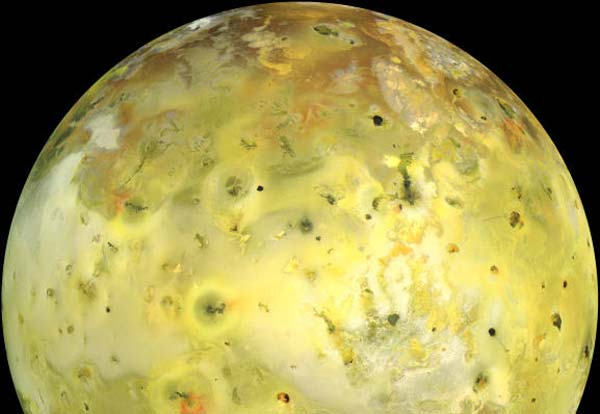
 <- A true color image of Io
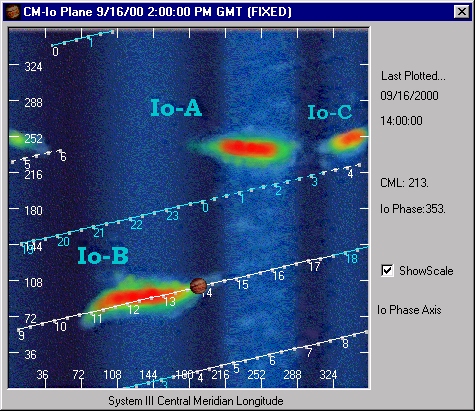
Even when the observing conditions are ideal we still do not have a 100% chance of seeing a radio storm. One way to help predict when a Jupiter storm is likely is by using a CML-Io phase plot. On the horizontal axis is the CML of Jupiter and the vertical axis is the phase of Io. In the figure below, the colors represent the probability of detecting a radio storm. Red is the most probable, with yellow being the next most probable, and blue and black the least probable.
The Radio Jupiter Pro software is a great way to make a CML-Io plot.
Using this program you can enter a date and the software will indicate
what the current CML and Io phase are and generate a CML-Io phase
plot. Below is a sample of one of these plots.

The sloping lines through the plot show the position of Io (y-axis) and the CML
of Jupiter (x-axis) that will be present on the date that was entered. The
numbers below the lines indicate the hour of the day, with zero being the
start of the next day. The small Jupiter image is a marker that shows the
current CML and Io phase. The time on the plot is in Universal Time and
must be adjusted when converting to local time.
The Io-A, Io-B, and
Io-C areas represent high probability areas. If the track of Io passes
through one of these areas a storm is not guaranteed but it is highly
probable. As we can see from this plot there should be a high probability
of detecting a storm on this day. If we convert the time to Eastern
Daylight Time (the east coast of the U.S. is four hours behind Universal
Time during daylight savings so we subtract four hours) we find that
there is a very good chance of
detecting a storm from about 7am to 10am Eastern Daylight
Time as the track passes through the middle of the Io-B
source. Unfortunately for observers on the east coast of the U.S. the
sun is still up and will not allow for a good measurement of
Jupiter. Observers on the other side of the Earth, however, are still in
darkness and have an opportunity to detect a Jupiter radio storm.
We can use the Radio Jupiter Pro software to determine when is the best time to observe Jupiter for radio storms. We can also find when storms should have occurred in the past.
Present and Future Observations
1.) Try using the software to find the best day this month to
observe Jupiter. At what time during this day would you observe?
2.) What is the next date of an Io-A storm?
Past Observations
On October 23rd of 1999 a large Jupiter storm was observed. Observers at NASA's Goddard Space Flight Center recorded the storm around 2:30 a.m. Eastern Daylight Time. Try entering this date into the Radio Jupiter Pro software and create a CML-Io phase plot.
1.) Are the conditions right for detecting a storm on this
date?
2.) Could you have detected a storm at your location? (remember to take
into account the time of day and if the sun is up)
Click on the links below to see the recording of the storm or listen to
a sound file recorded during the observation.
recording of October 23rd storm
sound file of storm
1.) Describe in your own words what a CML-Io plot shows and how they are
2.) If the track of Io passes directly through the Io-B source on a given
day, are you guaranteed to see a radio storm that day?