Radio Telescope – Basics of Observing Jupiter using Radio Jupiter Pro Program
From "So you want to observe Jupiter with Radio JOVE? — Planning your observing" by Jim Brown, JOVE Bulletin, July 2018
Included with the Radio Jove kit are two very useful software packages for Windows PCs. The first, Radio Jupiter Pro, will help you plan when to make your Jupiter observations to increase the likelihood of success. The second, Radio Sky-Pipe enables you to record your data. Both of these software packages are from Radio-Sky Publishing.
We will focus on an example of how Radio Jupiter Pro will help with planning for Jupiter observing; the specifics on configuring the software are available in the instruction manual.
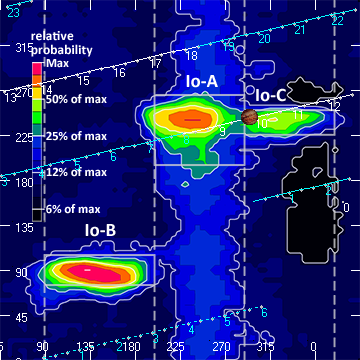
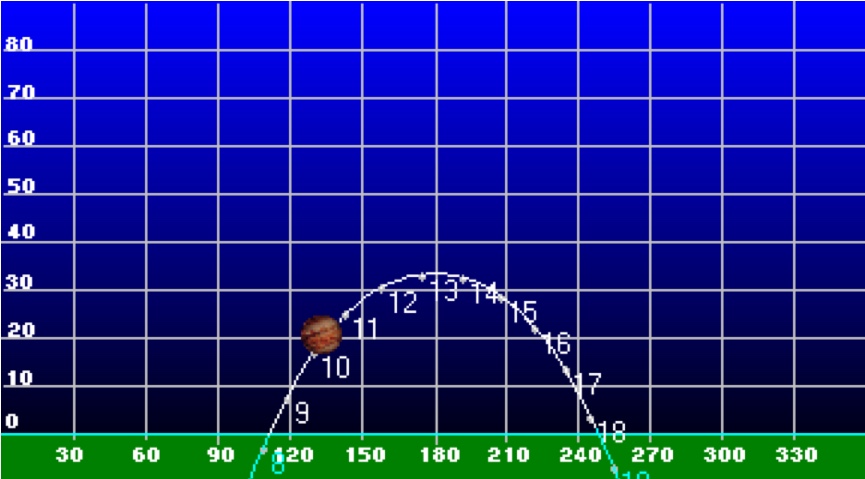
We will be using a real-life example from the observing run of Jim Brown. On 2018 January 6, as seen in Figure 1a (the CML-Io Phase plot), Jim noticed that there was a good opportunity to observe a Jupiter Io-C radio storm between the hours of 1000 and 1100 UT. He also noticed that Jupiter would be visible from his observatory in Pennsylvania, USA between approximately 0800 and 1800 UT. He found this by noting that the diagonal lines (indicating time) overlaid on the CML-Io Phase plot* crossed close to the center of the Io-C region between 1000 and 1100 UT. When these lines are white it indicates that Jupiter is above the horizon from your location, the blue lines mean that Jupiter is not visible. As shown in Figure 1b, during the predicted Io-C storm Jupiter appeared about 15 to 25 degrees above the horizon as seen from Jim's observatory. Jupiter will transit (that is it will reach its highest point in the sky) at about 1315 UT when it will be about 35 degrees above the horizon.
(* For details on the meaning of the CML (Central Meridian Longitude) - Io Phase plot please see the Radio Jove Science Brief on Jupiters Decametric Radio Emission and the June 2012 Jove Bulletin article for more on this topic. )


Figure 1b (Right). A view of the Altitude (Y-axis, degrees above the horizon) and Azimuth (X-axis, degrees clockwise from North) of Jupiter from Jim Brown's observatory in Pennsylvania on 2018 January 6. During the predicted Io-C event, Jupiter was about 15 to 25 degrees above the horizon.
Jim Brown was using the Radio Jove dual dipole antennas aligned East-West. He added phasing cable between the dipoles to point the beam southward (see 2011 May Bulletin to read about phasing). In Figure 2 we see an illustration of the night sky with two green line segments representing his dipole array. The beam pattern (the region of sky where the antenna is sensitive) is the green oval towards the south. The times we want to observe are when Jupiter is within the beam. The beam is oriented such that the point of highest sensitivity (the green plus sign) is near the transit point of Jupiter (on this date that was at about 1315 UT). The figure also illustrates the paths that Jupiter and the Sun will be taking across the sky and the times at each location. Note that the Sun was not up at the time of the Io-C event. Jupiter observations should be made at night, because Earth's daytime ionopshere can make Jupiter radio observing much more challenging. We know from Figure 1a that we will be passing through Jupiters Io-C source between about 1000 and 1100 UT. At that time Jupiter was just moving into the antenna beam (crossing into the green ellipse). Even though the antenna was not at its most sensitive at this point, Jim was still optimistic about receiving Jupiter radio emissions.

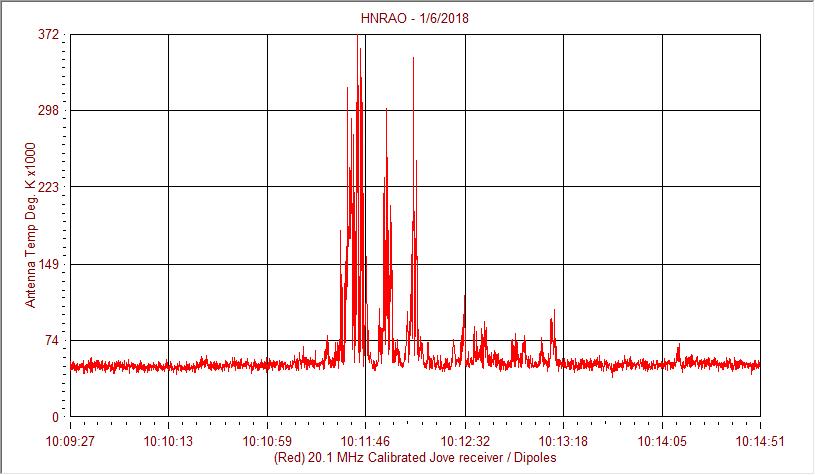
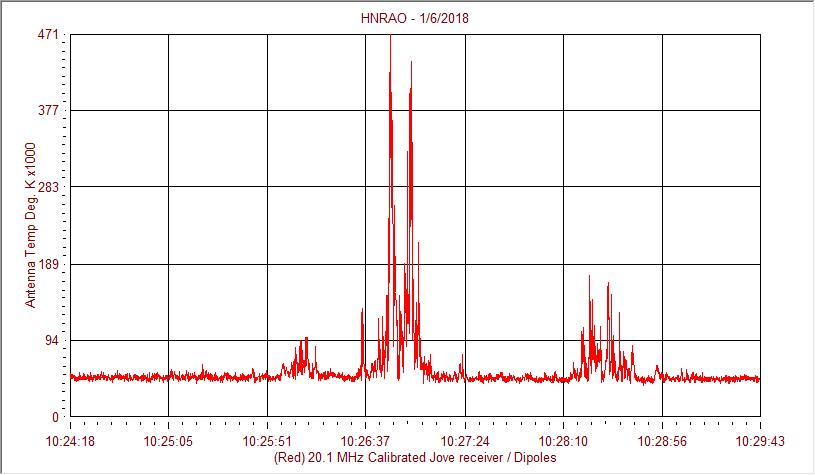
Figures 3 show us the Jupiter data recorded using Radio Sky-Pipe that Jim received between 1009 and 1029 UT on 2018 January 6. Of course there is no guarantee that you will detect Jupiter even when there is a predicted radio event occurring within your antenna beam; local weather conditions and local radio interference also may make it more difficult to successfully observe. As discussed in the May 2011 Jove Bulletin there are other factors that can influence observing Jupiter as well.
Imagining the Perfect Storm
Based on this example, can we now imagine what would have been the conditions for observing the "perfect storm"? First, we will want to be observing during a time period when we expect to pass through the heart of one of the Jupiter radio sources, namely the red or orange regions in Figure 1a. Second, Jupiter during this same time period should be nearly at transit from our location so that we will be able to detect these radio emissions even when they are weak. Third, these Jupiter radio observations should be made at night. Finally, our perfect storm observations should have great local conditions (no thunderstorms nor radio interference). You may not always have an opportunity to observe the perfect storm but don't let that prevent you from trying.
I hope this brief look at the Radio Jupiter Pro software will help you plan your next Jupiter observing run. Good luck!


