 The newsletter of NASA's Radio JOVE Project
"Solar and Planetary Radio Astronomy for Schools"
The newsletter of NASA's Radio JOVE Project
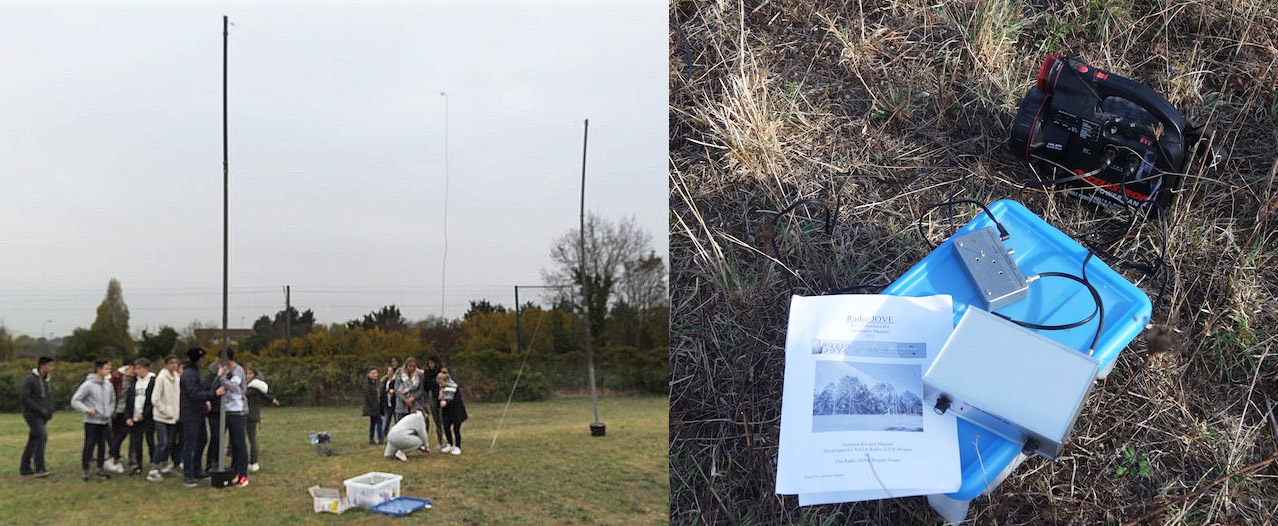
[Editor’s Note: Denis Costa is a science teacher at the Lycee Valin in La Rochelle, France. He recently sent us a report and photos of his students’ progress working on the Radio Jove project in their class.]
I became interested in radio astronomy in 2009, the International Year of Astronomy (IYA). I found an opportunity to work with the Bordeaux Floirac Observatory and Fabrice Herpin and his team who put their Wurzburg radio telescope online for anyone to use. Since that time I have had my students use this radio telescope to map the Galaxy at 21cm wavelength. It was a great experience. Unfortunately, last year the lab moved and the antenna is no longer available. I searched online for information on how to do radioastronomy with students, that’s when I heard about Radio Jove and I subscribed to the email distribution list. I bought a kit in April, 2016.
In France we have a class entitled “Methods and Experiments for Science” where the teacher can choose the project he or she wishes the class to work on. Because I am an astronomy enthusiast I tried to find astronomy projects that will interest my students. I teach 15 years olds and this year there are two groups of 20 students each. They have all chosen to be in this class even though some of them don’t really understand what the class is about and some tend not to be very curious. However that’s the exception since most of them are very enthusiastic. I work with two math teachers, Eric Petrequin, and Amhed Drif who also share the same interest in astronomy.
We began our work with Radio Jove testing a single dipole. For now our installation is collapsible, we are looking for a site where we can leave the antennas up indefinitely. We will soon begin teaching a bit about the theory of radio astronomy. On the 12-13th of April 2017, we plan on visiting the Nancay radio astronomy observatory.
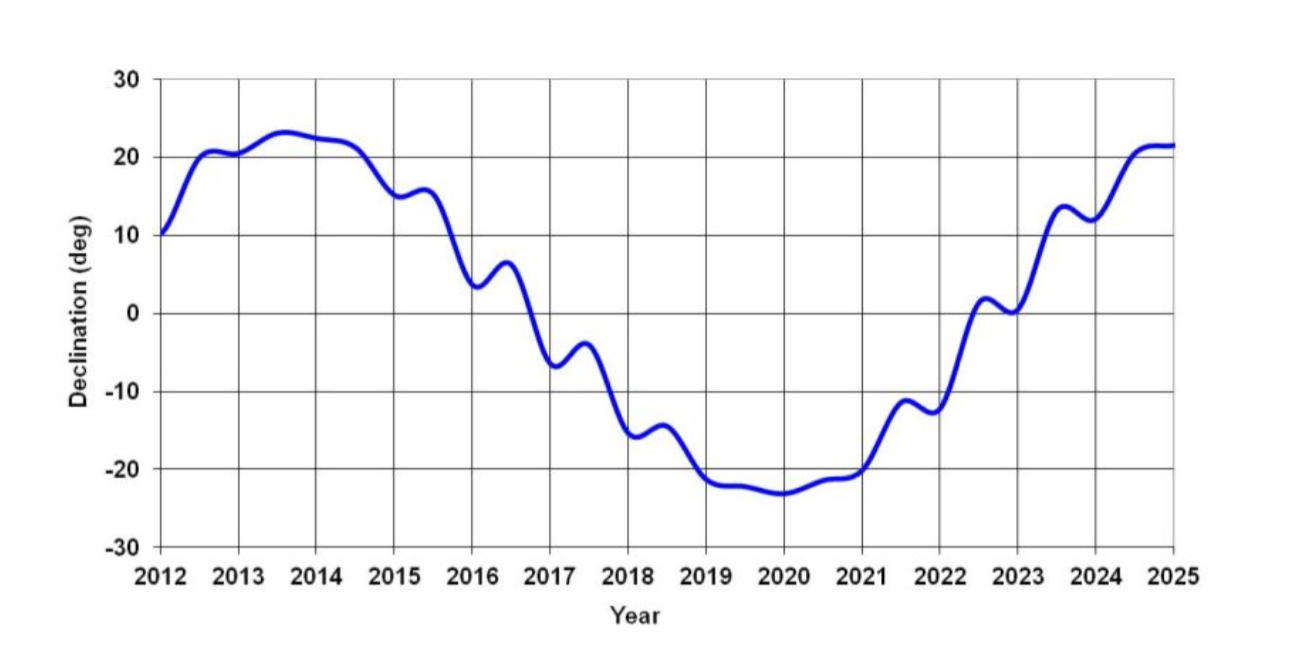
In May 2011, we reported that Jupiter had begun moving toward northern declinations, this led to a set of recommendation on changes in antenna height and phasing of the Radio Jove dual-dipole antenna system. Now over the next several years Jupiter will be moving back towards southern declinations. Please refer to your Radio Jove Antenna Kit Assembly Manual for specific recommendations on heights and phasings of your dipole arrays depending on your latitude.
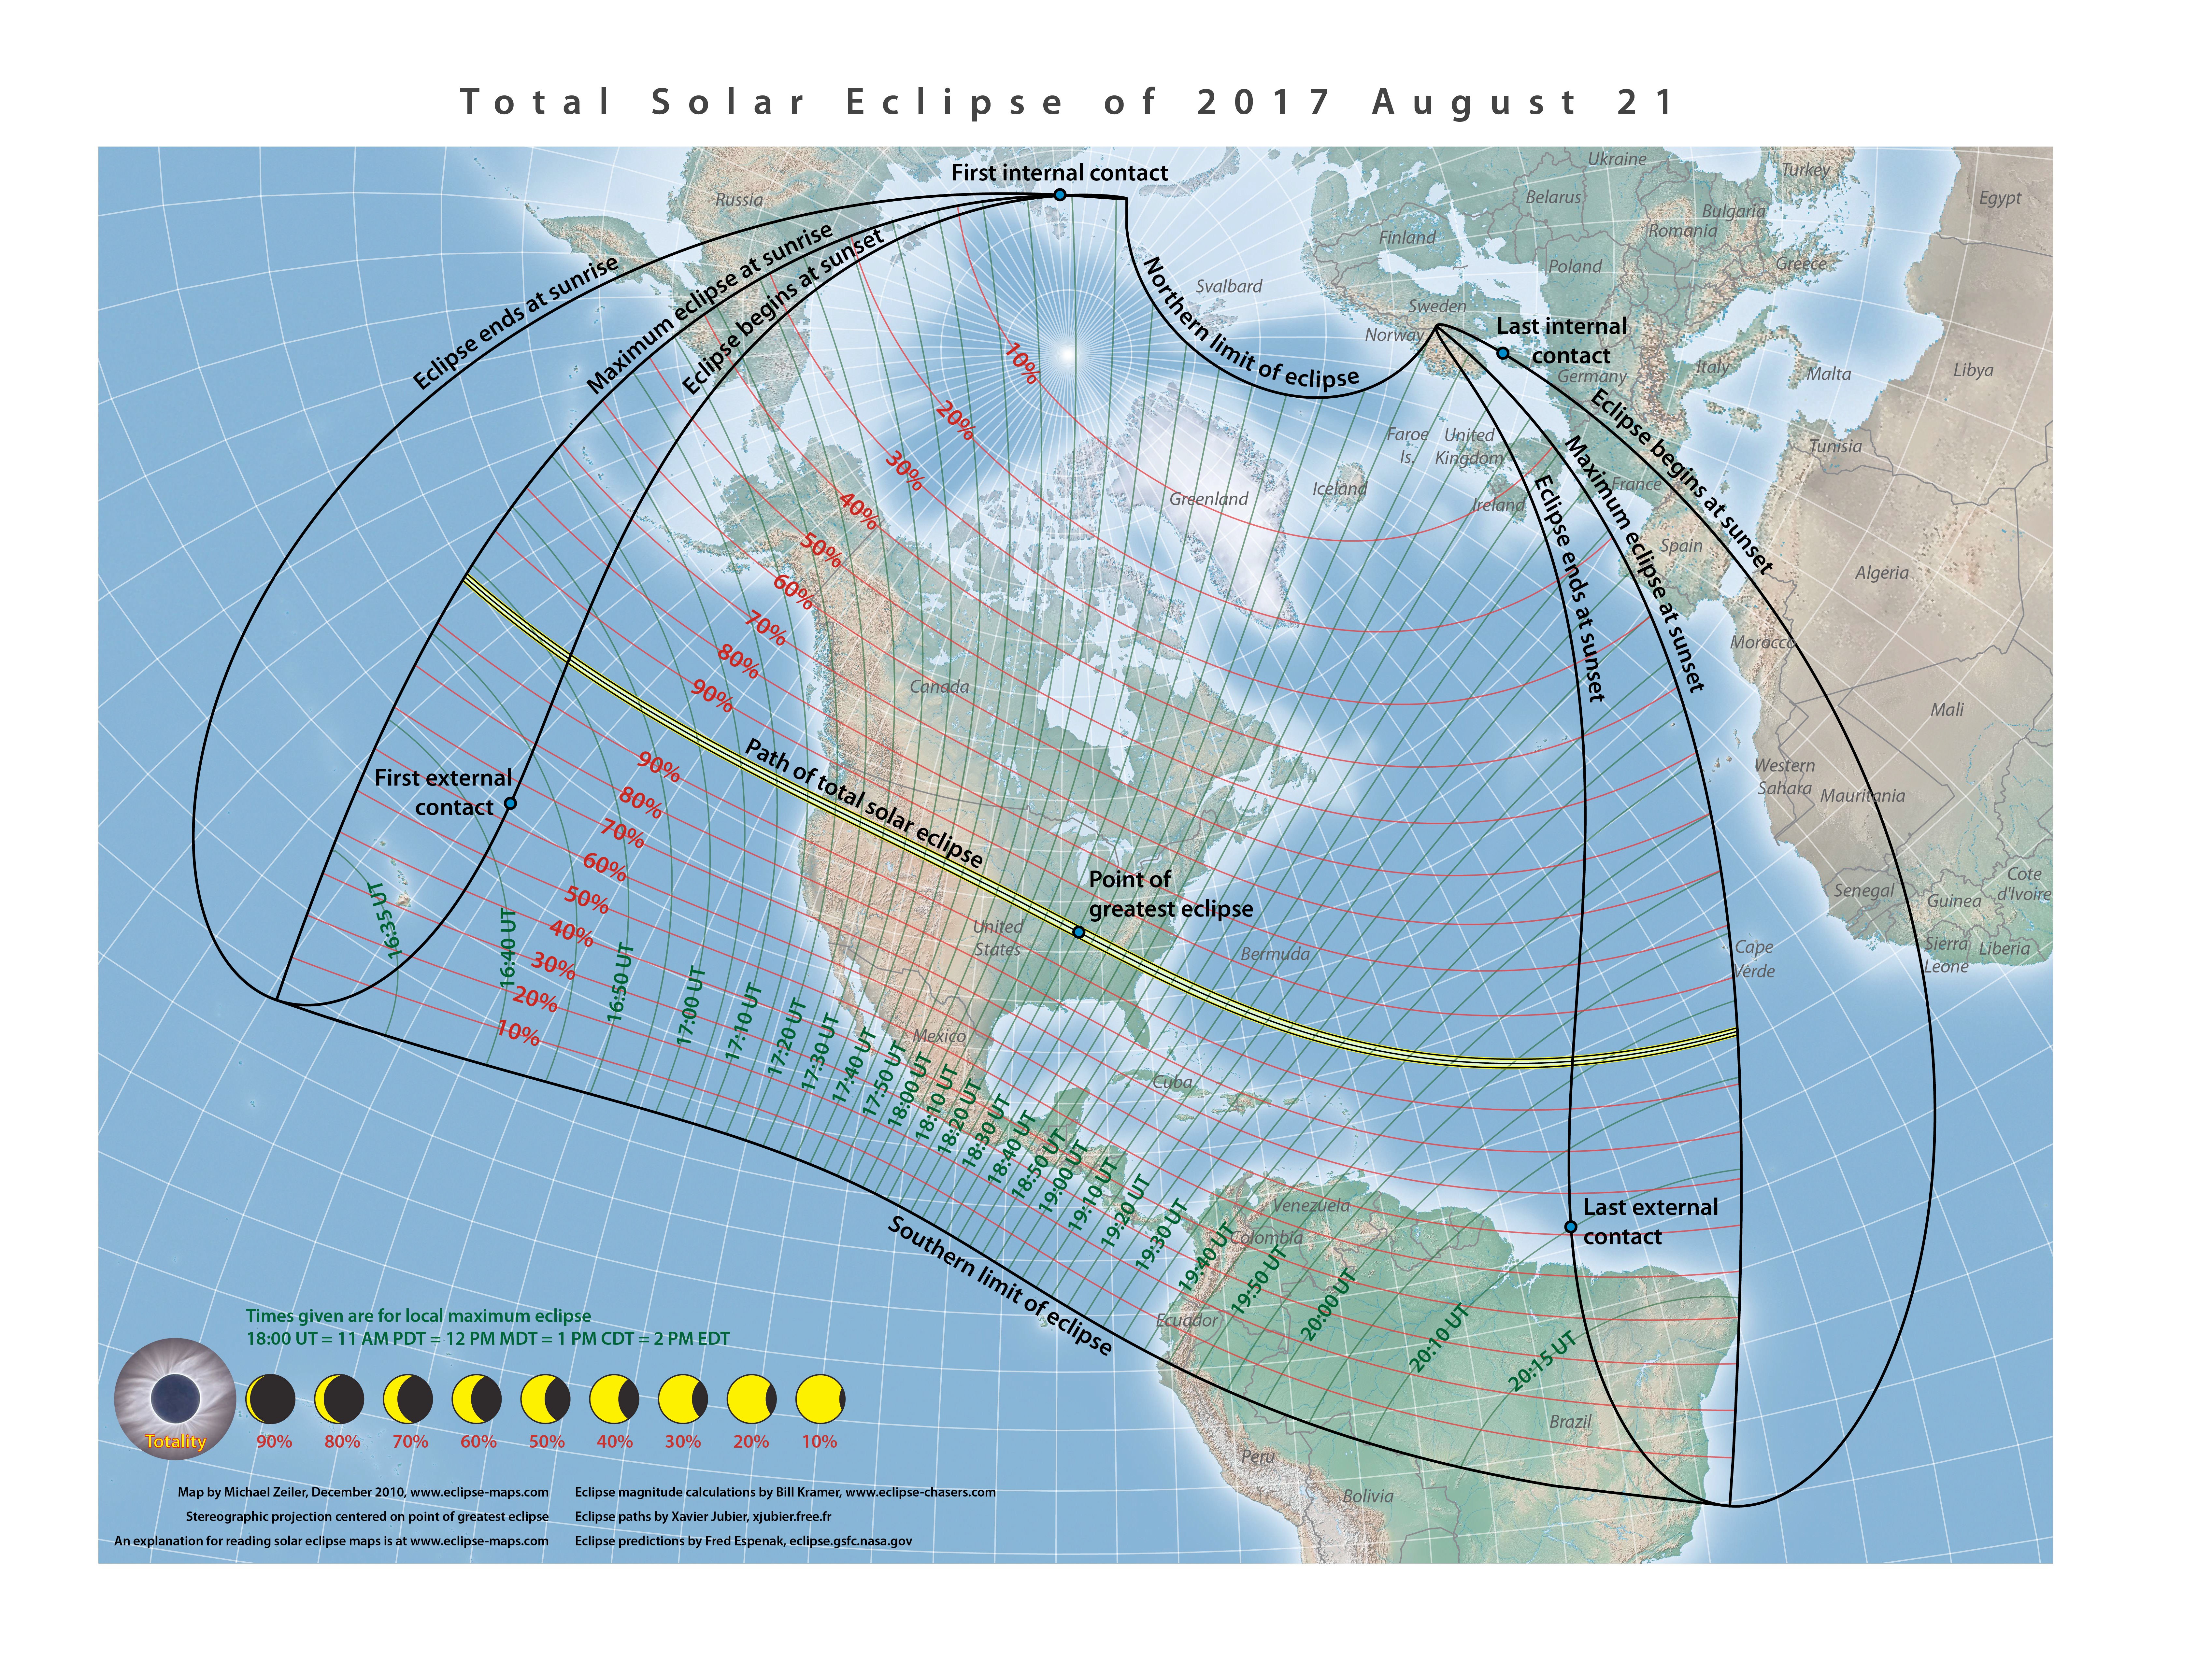
In the 2016 June issue of the Bulletin we presented details on how you can be involved in the total solar eclipse to take place on 21 August 2017. We are looking for participants anywhere in the Western Hemisphere to set up their Radio Jove equipment and take data on that day. If you think you will be able to join us please let us know! Please send email to Dr. James Thieman, and be sure to include the location where you intend to observe.
[Editor’s Note: In many previous Jove Bulletin articles we have
shown examples of dynamic spectrograms (see 2015 January and
2013 November issues, for descriptions and examples). The Radio
Jove single frequency plots of radio intensity versus time can
be thought of as slices through a spectrogram.
For example, in the 2012 June issue, Jim Brown compares
observations made of an Io-B storm as seen in his spectrograph
to his single frequency Radio Jove receiver. A dynamic spectrogram of
Jupiter radio data often reveals these bursts appear as arc-shaped structures.
In the article below, Dave Typinski provides a description of these arcs
and what we can learn from them.]
All this stuff about vertex early, vertex late, and polarization versus what to call an emission event can get confusing if one only looks at the CML-Io phase plane.
[Editor’s Note: Using years of single frequency data, a probability plot of Jupiter radio emissions has been created. These CML-Io Phase plots are described in the 2012 June issue and references therein. For a description of the A, B, and C regions of the plot you can also see the Radio Jove Science Brief, "The Jovian Decametric Radio Emission". ]
Here is the CML-Io phase plane with the zones marked (image from Jim Sky's Radio Jupiter Pro software). In this image, Jupiter's CML-III (represented by the horizontal axis) is in the "C source" range.
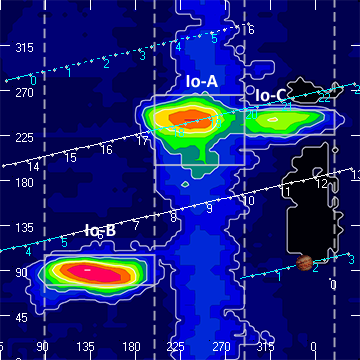
Let's ignore the added complexity of needing Io to be in the correct phase for Io-controlled emission. Let's just assume Io's phase doesn't modulate the Jovian decametric radio emission (DAM) probabilities. Perhaps that's sacrilegious, but do it anyway.
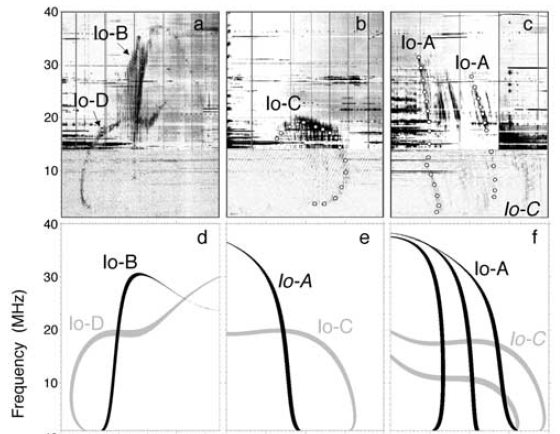
Io-B and Io-D produce vertex early arcs and Io-A and Io-C produce vertex late arcs. The image below is what they look like in a spectrogram. Image from Hess, "Modeling of Jupiter-Io Decametric Arcs, emission Beaming, and Energy Source", (GRL, 2008). The names are pretty self-explanatory -- i.e., vertex early arcs have their vertexes in the dynamic spectra occurring earlier than the rest of the associated emission. In these spectrograms, time is on the horizontal axis with earlier time being on the left.
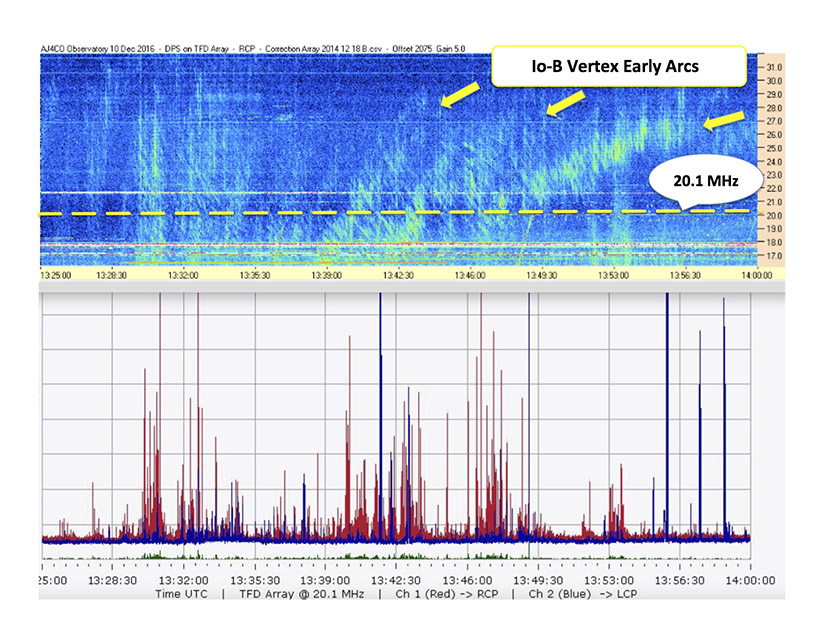
The figure below is an example where we compare observations of a Jupiter Io-B event as depicted in a dynamic spectrogram with the same event as observed at 20.1 MHz (similar to what a Radio Jove observer might detect but in this example using equipment with higher sensitivity). Following along the dashed “20.1 MHz” line on the spectrogram you can see stronger emissions (depicted in yellow and green) line up well with the clusters of bursts shown in the lower plot at the same times.
It's thought that there are two main decametric radio sources on Jupiter, one in the northern hemisphere and one in the southern hemisphere. The northern hemisphere source produces right circularly polarized (RCP) emission and the southern hemisphere source produces left circularly polarized (LCP) emission.
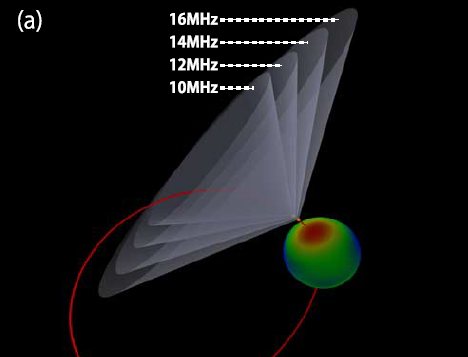
So, how do we get four zones on the phase plane -- the A, B, C zones along with the D zone which overlaps the B zone and wasn't strong enough to make its presence known back when the three "sources" were defined in the early days? Well, the emission is thought to be emitted in cones with very wide opening angles, like this image from Imai, "Angular Beaming Model of Jupiter's DAM Based on Cassini RPWS Data Analysis" (GRL, 2008).
As Jupiter spins on its axis, one side of the cone sweeps past Earth, then maybe 4 or so hours later the other side of the cone sweeps past Earth (remember, Jupiter rotates once ever ten hours, and the cones have less than a 180 degree opening angle, so call it 4 hours to make it easy to think about).
If we consider only RCP emission -- i.e., only emission from the northern emission source -- then we would see emission in the B zone then about 4 hours later some emission from the A zone (remember, we're ignoring the Io effect). If we consider only LCP emission -- i.e., only emission from the southern emission source -- then we would see emission from the D zone followed by emission from the C zone.
It has been found that the leading edges of the cones -- phase plane zones B and D -- always produce vertex early arcs. It has also been found that the trailing edges of the cones -- phase plane zones A and C -- always produce vertex late arcs. You know, the word "always" is often out of place when talking about Jovian DAM -- but as far as I know, that's how it is for the arcs.
The curvature of the arcs is thought to be produced as nested cones of slightly varying opening angle sweep past the observer. That is, there are many nested cones for each source, their vertexes at slightly different distances from Jupiter (the further away, the lower the emission frequency) and, as shown in the figure above, the lower the frequency, the narrower the cone opening angle. In highly technical terms, there is all sorts of funky geometry and orbital dynamics conspiring to produce the arcs -- and there are several competing theories that try to explain how it works. The important thing to know is that the A and C sides (trailing edges) of the cones produce vertex late dynamic spectra while the B and D sides (leading edges) of the cones produce vertex early dynamic spectra.
So, now we have a way to gain some knowledge about the emission source by looking at the arc curvature and the emission polarization. We can tell whether we're looking at emission from the north (A/B source) or from the south (C/D source) and we can tell whether the emission is coming from the leading (B & D sides) or the trailing (A & C sides) edges of the emission cone(s).
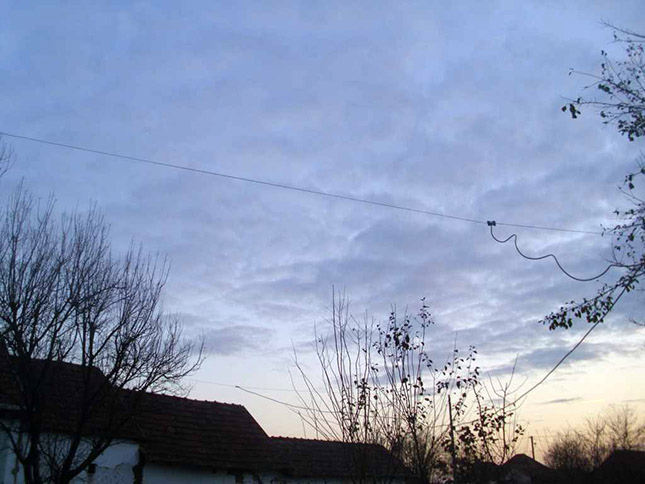
Ferenc Puskas sends us a photo of his dual dipole array under dramatic lighting in Furta, Hungary.
The JOVE Bulletin is published twice a year. It is a free service of the Radio JOVE Project. We hope you will find it of value. Back issues are available on the Radio JOVE Project Web site, http://radiojove.gsfc.nasa.gov/
For assistance or information send inquiries to: