 The newsletter of NASA's Radio JOVE Project
"Solar and Planetary Radio Astronomy for Schools"
The newsletter of NASA's Radio JOVE Project
The Juno spacecraft, named for the Roman goddess who could see through the clouds, launched successfully on August 5, 2011, and is rapidly approaching Jupiter for an encounter on July 4, 2016. Juno will provide a unique view of Jupiter’s atmosphere, magnetosphere, auroras, and gravity field. Specifically, Juno will 1) measure the water content in Jupiter’s atmosphere to test planetary formation theories, 2) map Jupiter’s gravity field to improve models of the interior, and 3) study the magnetosphere and auroras to provide connections between the solar wind, the magnetosphere, and the atmosphere (Figure 1).
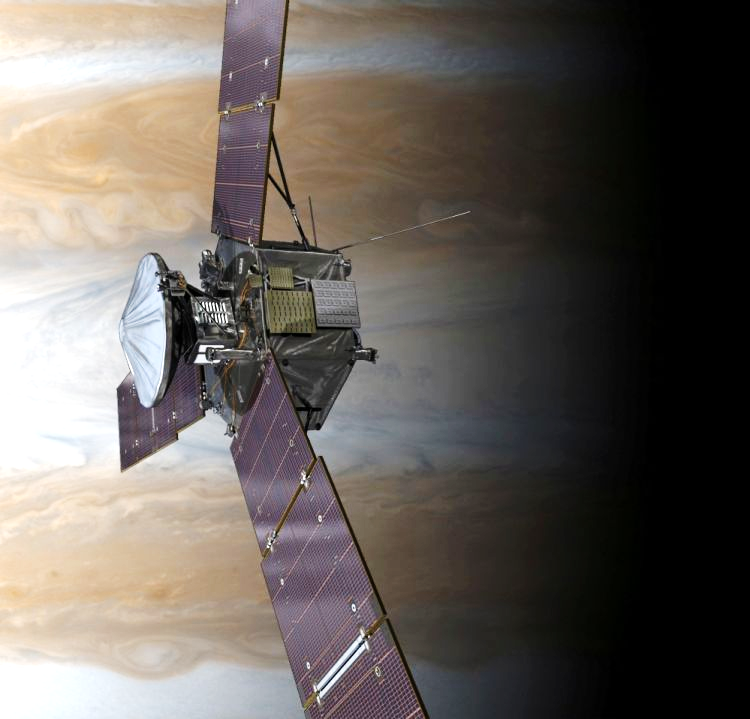
There are nine instruments on the spacecraft: Gravity Science (GS) to measure the mass and mass distribution of Jupiter’s interior; Jovian Auroral Distribution Experiment (JADE) to measure low energy particles related to the aurorae; Jovian Energetic Particle Detector Instrument (JEDI) to measure the high energy particles in the polar magnetosphere; Jovian Infrared Auroral Mapper (JIRAM) to measure infrared spectra of the upper layers of the atmosphere, to detect the presence of water and other molecules in the atmosphere, and to take images of the aurora; JunoCam will be the “eyes” of the spacecraft and will take visible images of the cloud tops; Magnetometer (MAG) measures the magnetic field and will create a 3-D map of Jupiter’s magnetic field; Microwave Radiometer (MWR) measures thermal radiation to help determine the structure of the atmosphere; Ultraviolet Imaging Spectrograph (UVS) will image the aurorae to make connections between the energetic particles and the aurorae and magnetosphere;and the Radio and Plasma Wave Sensor (Waves) to measure the radio waves from the magnetosphere, particularly from the auroral regions.
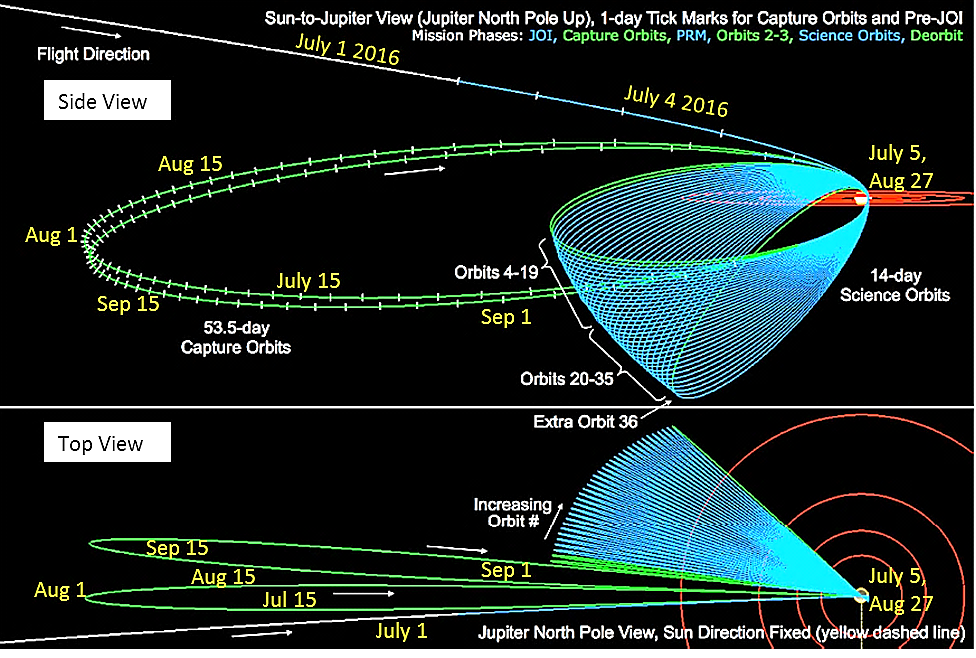
The overall size of the spacecraft is about 3.5 x 3.5 m with a 20 m wingspan for the solar panels. For stability the spacecraft will spin 2 times per minute. The spacecraft is planned to come closer to Jupiter than any other spacecraft and even pass through some of the radiation belts. After the encounter on July 4, 2016, the mission will last approximately 20 months. There are two 53-day capture orbits and then approximately thirty-two 14-day science orbits to comprise the primary mission (see Figure 2). In February 2018 the spacecraft will be guided in a controlled deorbit into Jupiter. The total cost of the mission is expected to be about 1.1 billion dollars.
Most relevant to the radio astronomy community is the Waves experiment to detect radio emissions from the magnetosphere. Because of a unique polar orbit, Juno is expected to tell us much more about Jupiter’s aurorae, the radio sources, and the magnetosphere and plasma environment. The Waves instrument will be operating as of January 2016 during the inbound phase to Jupiter and thereafter. The Waves instrument has electric and magnetic antennas to study the low frequency spectrum: 50 Hz – 40 MHz for the E-field dipole antenna, and 50 Hz – 20 kHz for the magnetic coil. The frequency resolution is 100 kHz and temporal resolution is 1s for the Waves instrument.
Many professional ground-based radio observatories will be observing Jupiter in coordination to supplement Juno radio observations of Jupiter. The coordinated ground-based decametric radio (DAM) observations will provide polarization and high resolution data in comparison to the Juno Waves in-situ measurements, provide multi-point measurements for reference, and will foster collaboration between ground-based radio observers. Juno will provide “near field” measurements of both particles and waves, while ground-based observers can provide “far field” wave data for comparison. This unique opportunity should provide new insight into Jupiter’s radio emission mechanisms.
The amateur Radio Jove community can participate by observing Jupiter during the upcoming Jupiter observing season [see related article in this bulletin]. We encourage all Radio Jove observers to make observations of Jupiter in 2016 and through the end of the Juno mission. To more easily compare events of interest, we also encourage you to upload your data to the Radio Jove Archive (http://radiojove.org/archive.html). More information about potential coordinated observations will come in the near future. Let’s hope we have a great year for Jupiter in 2016.
Another Jupiter observing season is upon us. Jupiter’s elongation was +60° on November 11, 2015. That is, the angular distance between Jupiter and the Sun increased to 60° on that date, with Jupiter leading the sun in their march across the sky. Here is a diagram showing the Jupiter-Sun-Earth geometry throughout this current observing season.
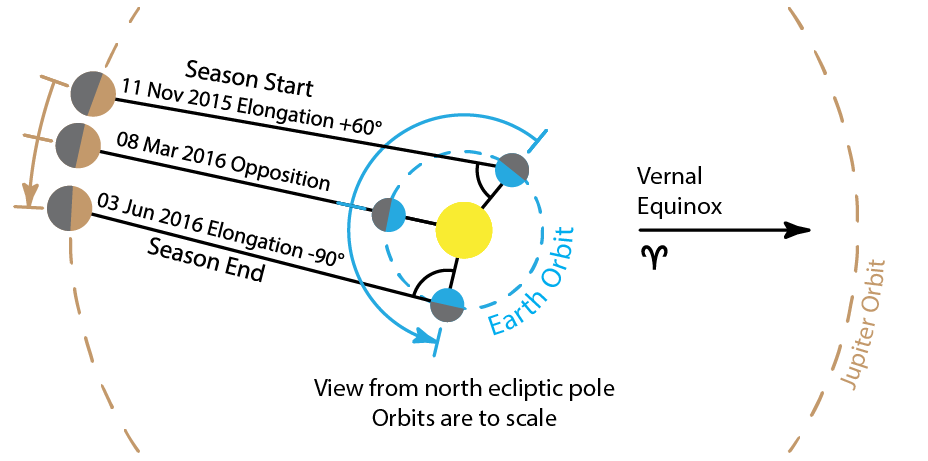
Jupiter emission varies smoothly from quite strong during opposition to very weak during conjunction. The observing season dates shown in Figure 1 are only rough guidelines to the time over which watching for Jovian emission is generally more profitable. It is possible to observe Jovian emission weeks or months into the off-season if the emission power is high enough to make up for the added propagation distance and thicker terrestrial ionosphere. Such occurrences are rare. Increased antenna gain can extend the length of the useful observing season by bringing weaker point-source Jovian signals further above the whole-sky galactic background.
See the 2014 Bulletin article for more plots with corresponding sky views. http://radiojove.gsfc.nasa.gov/library/newsletters/2014Aug/index.html#5
A plot of Jupiter elongations from 2015 through 2016 is available on the SUG site at http://www.radiojove.org/SUG/Ephem/Jupiter%20Ephemerides%202015-2016.pdf.
Editor's Note: an expanded version of this article is available under Publications at the Spectrographic Users Group (SUG) website: [Link]
Purpose of the Evaluation
The intent of the evaluation of the plug in dongle (software defined radio) was to see if it was viable for Jupiter and solar observations. It was hoped that this inexpensive unit would provide a low cost spectrograph to supplement the Radio JOVE single frequency receivers. Other amateur radio astronomers would also benefit.
The Jove receiver has a bandwidth of 7 kHz and can be tuned over a 300 kHz frequency range centered on 20.1 MHz.
Using Radio-SkyPipe the Jove receiver simply displays the amplitude of bursts at the frequency it is tuned to.
The dongle, when used with Radio Sky Spectrograph (RSS) software can display activity over a 3.2 MHz wide frequency band in the range of 25 - 1750 MHz. There are other, more expensive, dongles available to the community, however, we chose to start with the least expensive as a starting point.
The Dongle
These units are based on the RT820 (R820T2) tuner IC made by Rafael
Micro. As such, they have a frequency capability from
approximately 25MHz-1750MHz (different models have slightly
different frequency spans). These units plug directly into the
USB port of a computer. During this evaluation, I had no test
equipment available to measure specifics with this unit. The
evaluation is based on visual observations only. The specific
dongle under evaluation is the unit sold by NooElec (http://www.nooelec.com) NESDR
Mini 2 SDR & DVB-T USB Stick (RTL2832 + R820T2). The cost as of
this writing is $24.99. This particular dongle, according to
NooElec, has better specifications than the standard “off the
shelf” dongle. I chose to purchase the extruded metal case
($14.95) for it to possibly shield it from RF interference. This
turned out not to be necessary. I did do a visual comparison with an “off the shelf” dongle and did see a difference although I would have to say the differences were minor.
The Software
It will be necessary to download a specific set of (free) software to
make the dongle function as a spectrograph. Step-by-step
installation instructions are provided in the full article on
the SUG website. It must be noted here that at the time of
this writing, the software (Radio Sky Spectrograph - RSS) available by
Jim Sky (Radio Sky Publishing) was used. It has, however continued to
evolve and newer versions are constantly being developed. So check
with Radio Sky Publishing for the latest versions and updated capability.
The Computer
Two different computers were tried for this test. The first was a Toshiba Intel Core i3 CPU M370 2.4 GHz Dual core processor with 4 GB RAM running Win7 Home Edition. The second was a Dell Inspiron 1150 Celeron Mobile Pentium processor CPU 2.60 GHz 1.25 GB RAM running WinXP Home Edition.
The only successful computer used in this evaluation was the Toshiba laptop. The Dell Inspiron 1150 laptop was simply not fast enough to be effective. The display was extremely slow and sporadic. I couldn’t get consistently good spectra data from it. There might be a computer running XP with a much faster processor and more memory, so it might be feasible. I don’t have access to a computer like that so the results with the Dell XP laptop were disappointing. This sets limits on the type of processor and processor speeds necessary for the dongle to function as a reliable spectrograph platform.
The set up and settings
The first test of the unit was with the standard Radio JOVE dipoles fed from a multi-coupler. The multi-coupler output was fed into an 18 db filter/amplifier then through a KAY attenuator set at 8 db.
The purpose of the filter/amplifier was to overcome the 10 db loss of
the NooElec Ham It Up v1.2 - RF Upconverter. The upconverter was
necessary to allow the dongle to receive below 25 MHz. A later update
to RSS, version 2.4.21, eliminated the need for the upconverter. The new version of RSS extends the range of the RTL+R820T below the usual 24 MHz limit without an upconverter or hardware modification. Using a 2.4 Mega Samples per
Second (MSPS) rate, it is possible to see signals down to about 15 MHz, but many people have reported going much lower.
Without the need of the upconverter, the filter/amp was also no longer
needed. A feature of Radio Sky Spectrograph software is called
RTL-Bridge. It is used to allow the RSS software to talk to the
dongle. Various settings in RTL_Bridge were tried. The stated
specifications of the dongle are optimized at 2.4 MSPS (set in RTL_Bridge) however I did experiment with the full
capability of 3.2 MSPS. This resulted in a fall off at the top and
bottom edges of the bandwidth as seen in Figure 1. With the most
current version of RSS, the following settings seemed to result in the
best performance.
| Center Freq. | FFT Average | FFT Size | Gain | Sample Rate | Data Scale |
| 20.1 MHz | 25 | 256 | 49.6 | 2.4 MSPS | 4 |
Once producing a spectrum, it will be necessary to adjust the Color Offset and Gain in RSS to produce the desired display. For these tests, in RSS, under Color, I selected the color file AJ4CO-Rainbow.
The Observations
Figure 1 is the result from the February 28, 2015 Io-B storm observed with the dongle. The configuration is in the chart. The amp/filter and KAY attenuator were in line before the dongle. Faraday lanes are clearly visible as well as modulation lanes.
| Center Freq. | FFT Average | FFT Size | Gain | Sample Rate | Data Scale |
| 20.1 MHz | 25 | 256 | 38.6 | 3.2 MSPS | 20 |
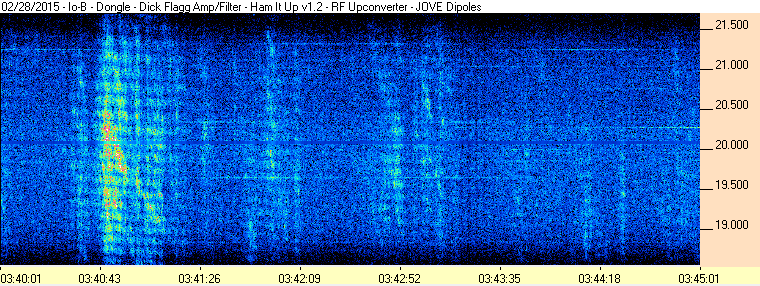
Figure 2 is the result from the March 7, 2015 Io-B storm. S-bursts were seen with the dongle. The configuration is in the chart. The amp/filter and KAY attenuator were in line before the dongle.
| Center Freq. | FFT Average | FFT Size | Gain | Sample Rate | Data Scale |
| 20.1 MHz | 25 | 256 | 38.6 | 3.2 MSPS | 20 |
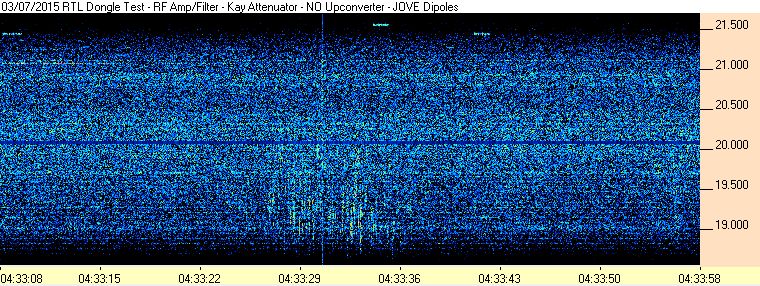
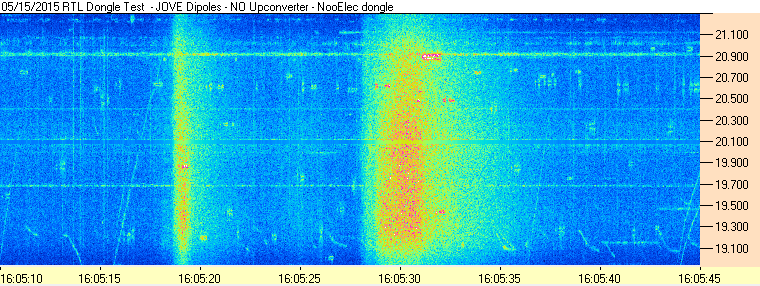
Figure 3 demonstrates a solar burst seen with the dongle on May 15, 2015. The configuration of the dongle is in the chart. There was no amp/filter or KAY attenuator in line with the dongle.
| Center Freq. | FFT Average | FFT Size | Gain | Sample Rate | Data Scale |
| 20.1 MHz | 25 | 256 | 49.6 | 2.4 MSPS | 3 |
Unsolved Problems
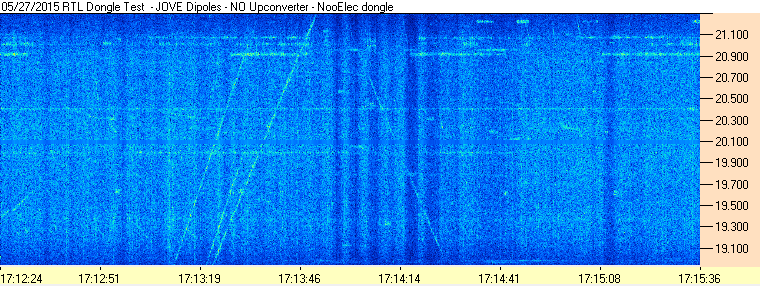
It seems that the filtering in the dongle is lacking. During the daytime, strong sweepers often show a mirror image we believe is aliasing (Figure 4). Sweepers move from low to high frequency. You can see the “mirror” image here moving from high frequency to low.
Another problem is, if there is Jupiter activity above or below the 2.4 MHz window you have the dongle set to, you won’t see it.
Conclusion
The tests confirm that the dongle is a viable spectrograph for Jupiter
and the sun. Advances in technology have made less expensive
Software Defined Radios and the dongle useful for Jupiter and
solar observations. There is currently testing underway by the
Spectrograph Users Group with a more advanced dongle called the
AirSpy being distributed by the software developer, SDR#. Airspy
(http://www.sdrsharp.com/) is an advanced open-source software defined radio receiver with the highest dynamic range in its price range. Its advertised frequency span is continuous from 24 - 1800 MHz with the ability to show a 10 MHz bandwidth, making it more ideal for Jupiter observations. It is possible that the same RSS software that allows the dongle to work at lower frequencies will permit the AirSpy to work at those frequencies also.
Many indoor and hydroponic gardens rely on fluorescent and high intensity discharge (HID) lights which require a high powered ballast to limit current flow.
Recently the American Radio Relay League (ARRL) issued several complaints to the Federal Communications Commission (FCC) regarding radio frequency interference generated by grow light ballasts.
The following is from the ARRL Letter of 30 July 2015.
"The level of conducted emissions from [these devices] is so high that, as a practical matter, one RF ballast operated in a residential environment would create preclusive interference to Amateur radio HF communications throughout entire neighborhoods," ARRL General Counsel Chris Imlay, W3KD, wrote in each complaint. The devices exceeded conducted emission limits under all test conditions, "sometimes by extreme margins, throughout most of the HF range," Imlay said in his letters.
The ARRL cited three units in particular:
Such high levels of radio frequency interference (RFI) can be a disaster for radio telescopes such as the Radio Jove system.
If you are experiencing high levels of broadband interference on your Jove system the culprit may be one of these grow light ballasts. Yet one more thing to look for amidst the numerous RFI sources such as power line arcing, electric motors, automobile ignition systems, computers, switching power supplies, track lighting fixtures, and plasma TV sets.
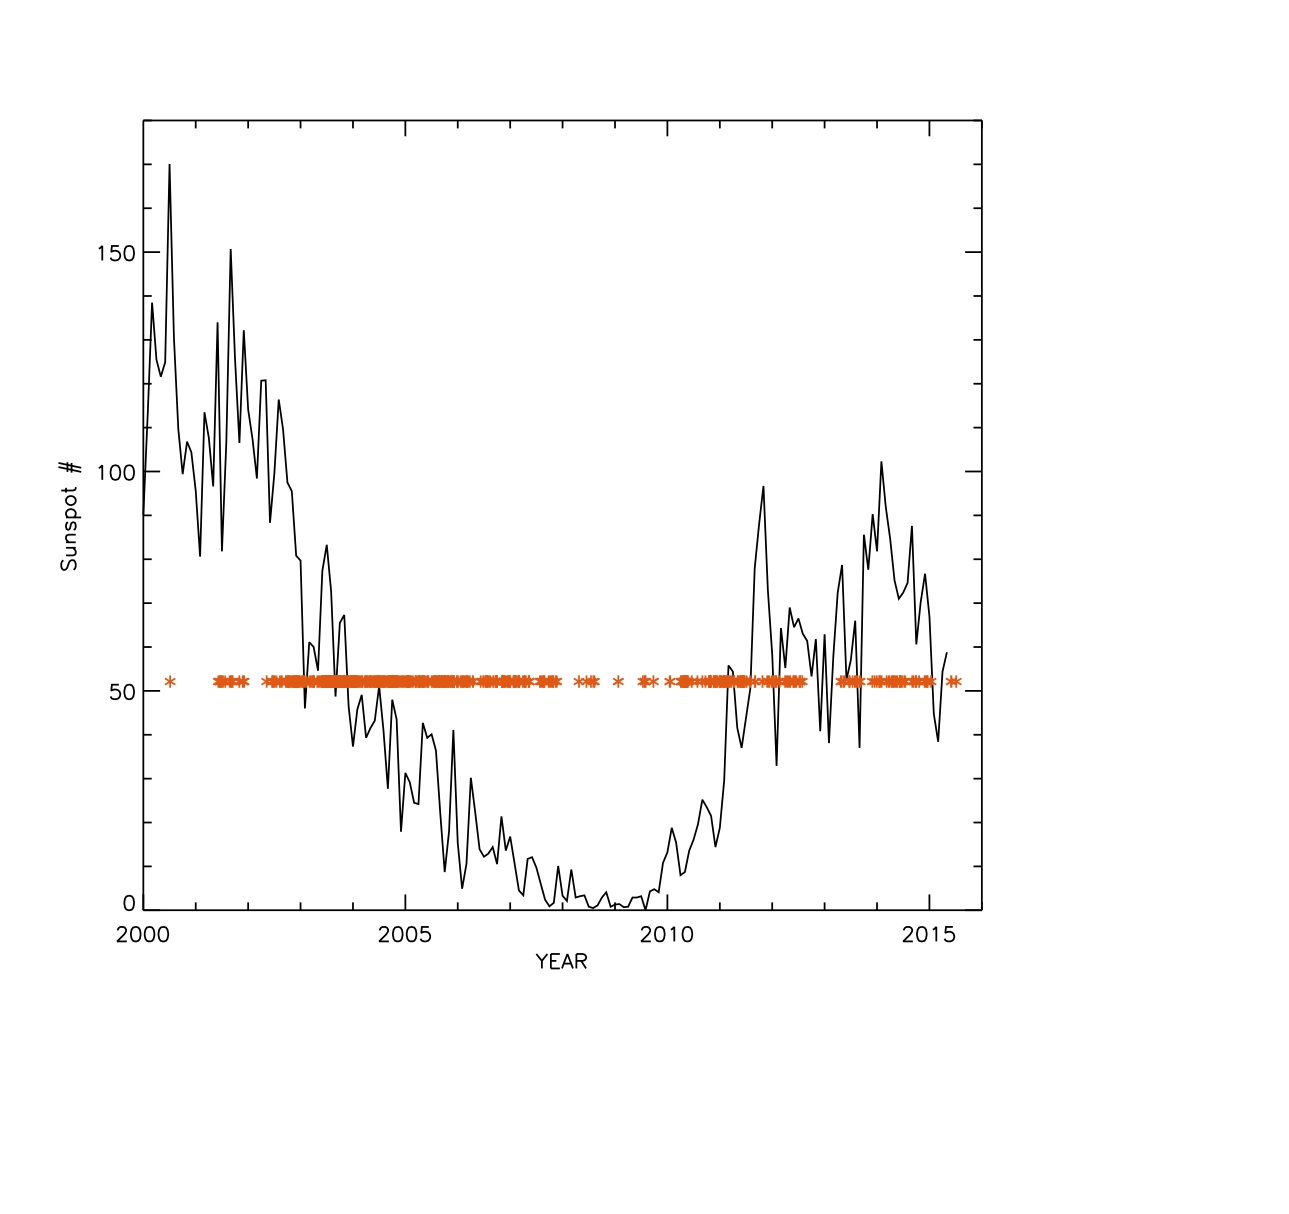
For the last 13 years, the Radio Jove Archive has provided an opportunity for observers to submit their data, compare their results with others, and use these data for studies of Jupiter, the Sun and the Galaxy. These data include images, sound files, observation logs, and Radio Sky-Pipe files.
Solar Data: The archive now contains almost 5,000 observations of solar radio bursts over a period spanning one solar cycle. Figure 1 is a plot of Sunspot Number from years 2000 to 2015, the dates of Jove Archive solar observations are indicated with an orange asterisk.
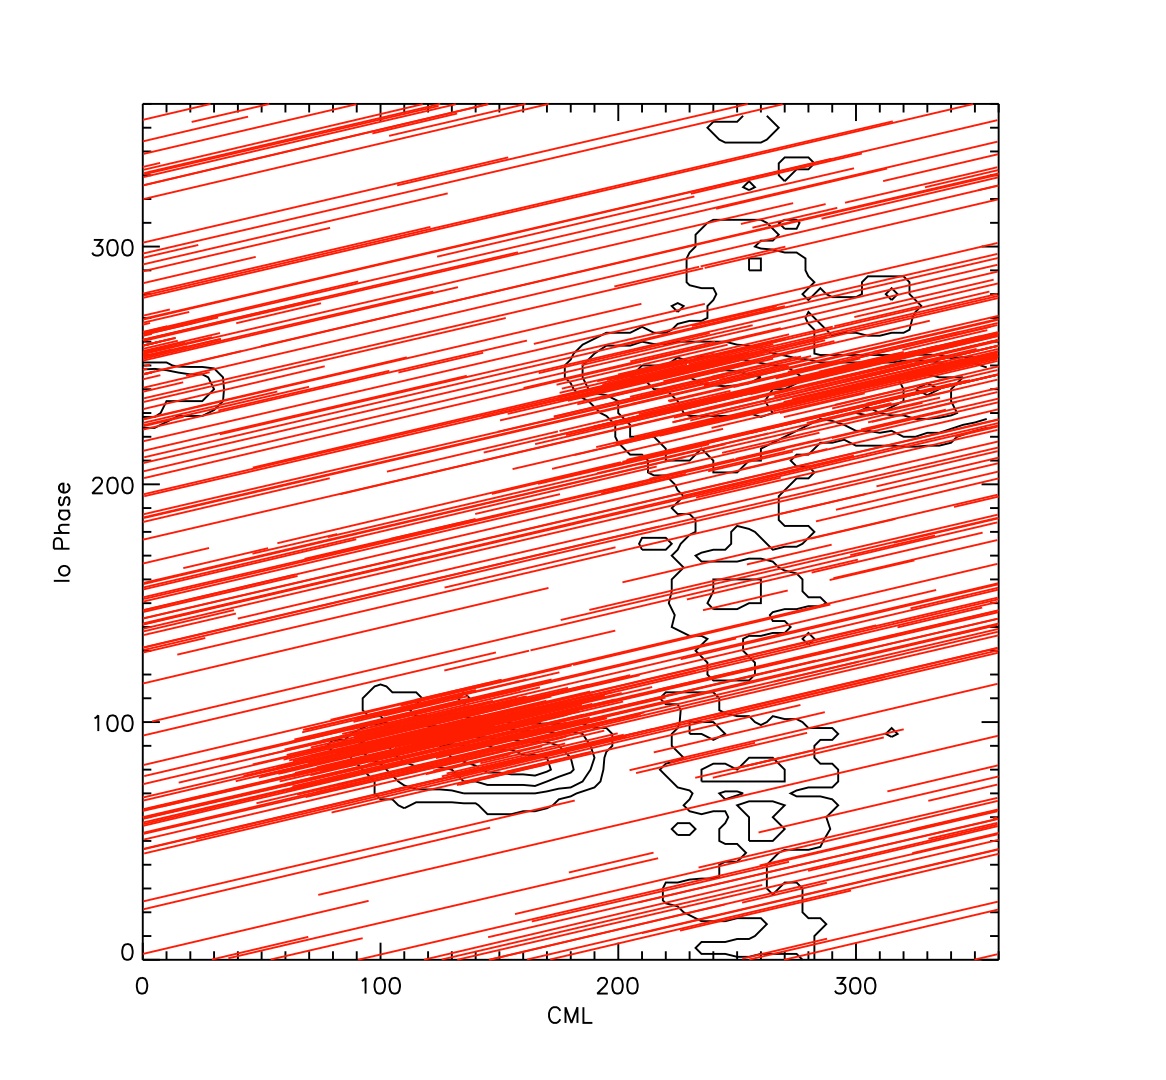
Jupiter Data: The archive holds nearly 1500 observations of Jupiter of which about half include Radio Sky-Pipe files. One way to represent the data coverage of Jupiter radio observations to is plot the observation periods in coordinates representing Jupiter’s Central Meridian Longitude (CML) and Io’s orbital position. This phase space plot for the archived Radio Sky-Pipe files for Jupiter is displayed in Figure 2. Figure 2 includes a contour plot of Jupiter radio storms predictions overlaid by red line segments indicating the time span of each Jupiter observation for which the archive holds a Radio Sky-Pipe file. The observations span much of the phase space of this plot but are also clearly clustered around the Jupiter radio storms, Io-B, Io-A and Io-C. The combined holdings of all Jupiter observations ( that is images, sounds, and Radio Sky-Pipe files) would fill the CML/Io Phase space.
Please visit the Radio Jove Archive at http://radiojove.org/archive.html to browse and download files. To submit your radio observations to the archive please contact me for more information.
When a meteor plunges through Earth's atmosphere it leaves behind not only a brief visual display of its passage but also an ionized trail. This region of enhanced ion density can act like a mirror for radio waves, reflecting ground-based radio tranmitters back to Earth. We have two brief items on detecting meteors using this radio reflection technique.
Jake Fiechtner, Sierra Messick, Xander Pickard, Colin Miller, Zac Marquardt and Lexia Wyse, students at Berthoud High School in Berthoud, Colorado along with advisers David Eckhardt and Dr. Terry Bullet operated a FT-450 transceiver attached to a 5.4 meter dipole antenna to observe these radio reflections at 55.25 MHz. They picked up radio transmissions from Mexico reflected off of ion trails from meteors during the Perseid meteor shower in August. As part of their effort they compared two methods of identifying meteors: manual identification and an automated method using Dr. Terry Bullet's Echo software. They found the Echo software identified 23% more meteors than their manual method.
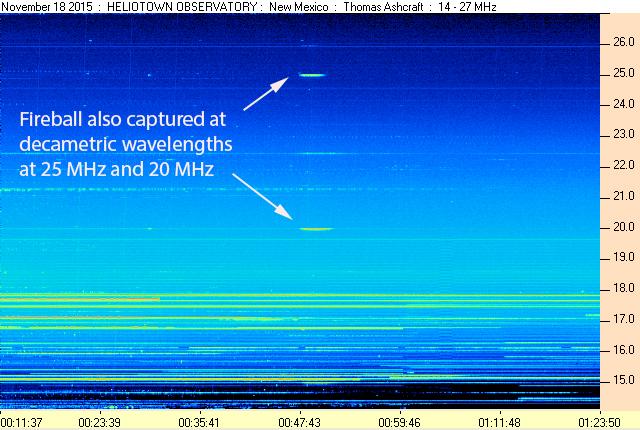
Thomas Ashcraft reports that on November 19th, 2015 he picked up metor scatter from a fireball associated with the Taurid meteor shower. Besides detecting reflections from transmitters at 77.25 MHz and 67 MHz, he also reports reflections of transmissions from WWV at 25 MHz and 20 MHz, within range of Radio Jove equipment. Though he was not using the standard Radio Jove set this event opens up exciting possibilities for Radio Jove observers. Any one else want to try to catch a meteor trail?
For more details on Thomas Ashcraft's observations please see his web page at http://www.heliotown.com/Fireball_Nov182015_Radio.html
The JOVE Bulletin is published twice a year. It is a free service of the Radio JOVE Project. We hope you will find it of value. Back issues are available on the Radio JOVE Project Web site, http://radiojove.gsfc.nasa.gov/
For assistance or information send inquiries to:
or
