 The newsletter of NASA's Radio JOVE Project
"Solar and Planetary Radio Astronomy for Schools"
The newsletter of NASA's Radio JOVE Project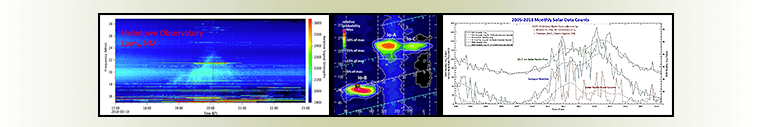
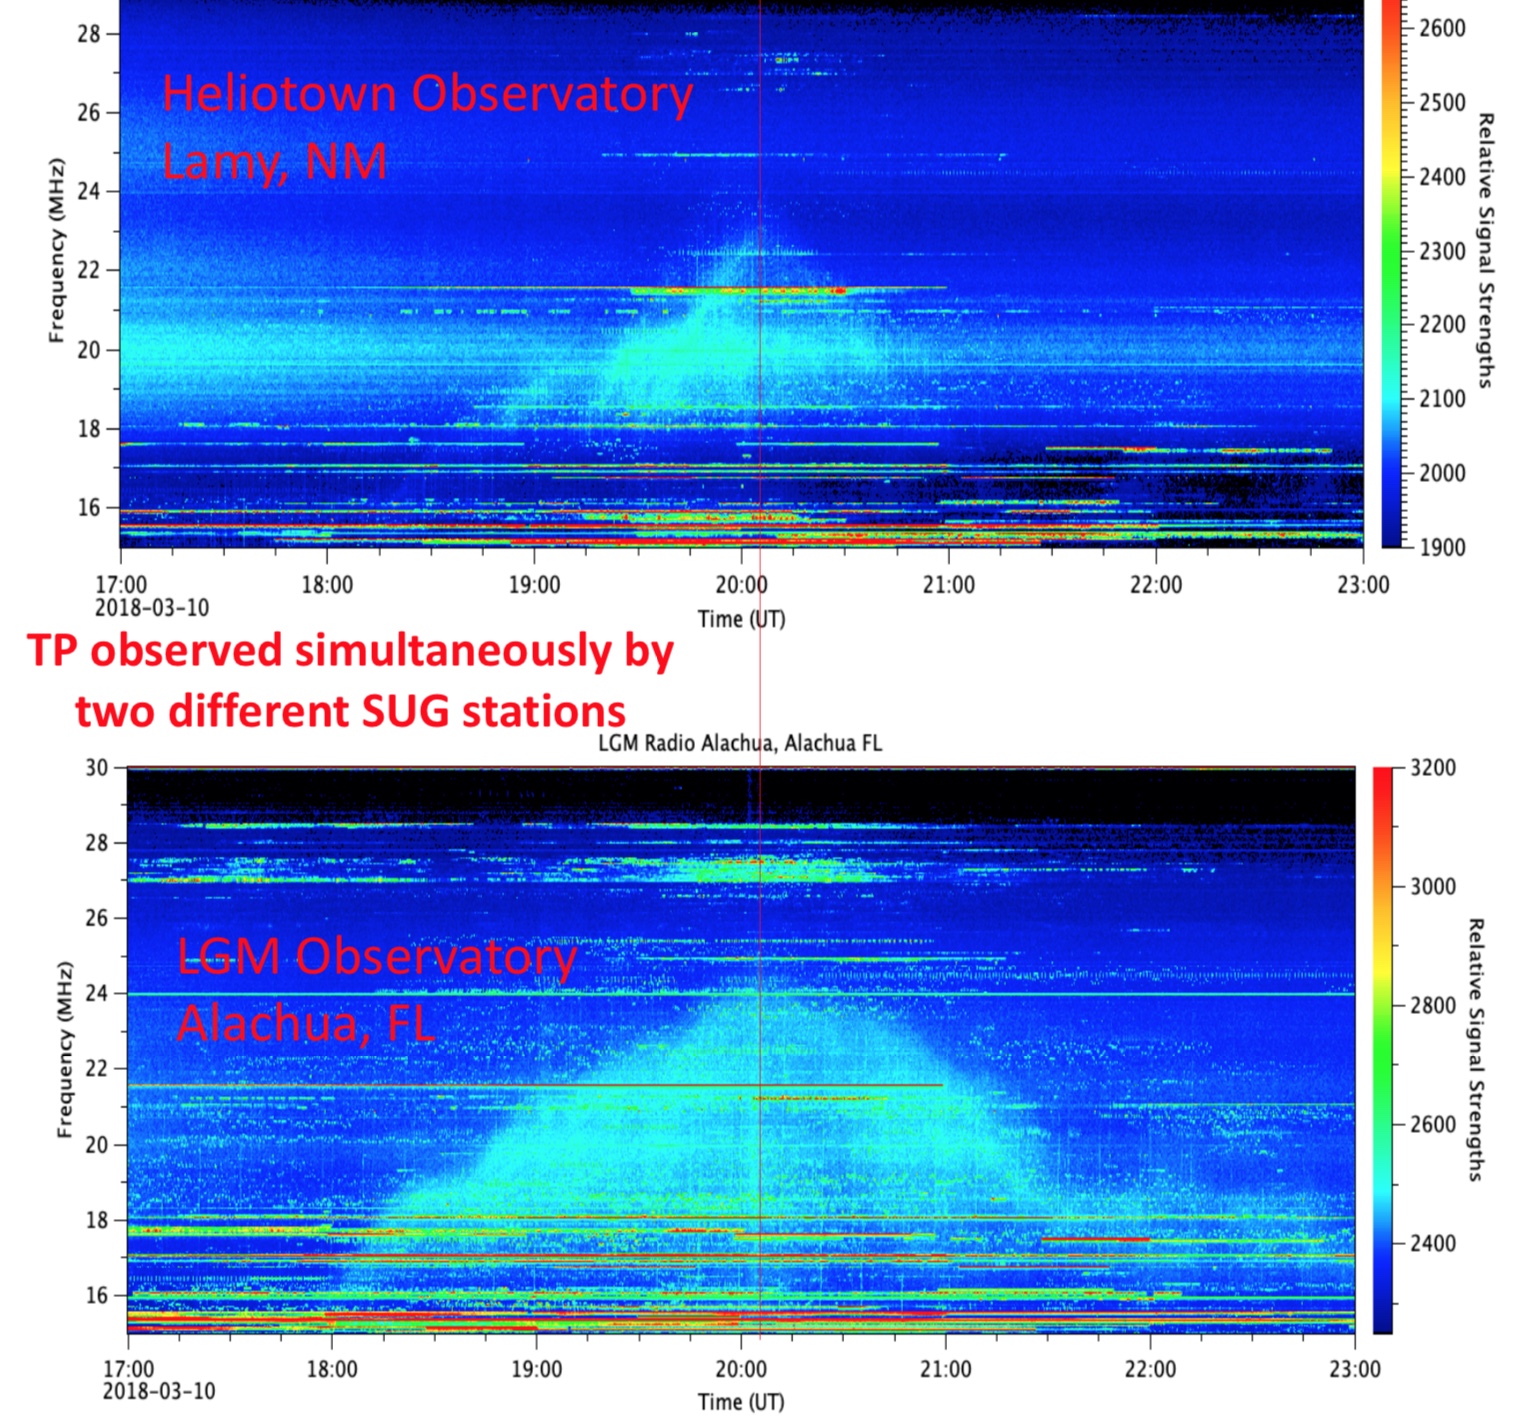
A member of the Radio JOVE team, Dr. Shing Fung, presented research results1 at the December 2019 meeting of the American Geophysical Union (AGU) in San Francisco, California, USA. Dr. Fung used data from several amateur radio observatories associated with Radio JOVE to explain strange features often visible in dynamic spectrograms at frequencies between 15 and 30 MHz. These features are being named TeePees (or TPs) because of their triangular shape reminiscent of the portable cone-shaped dwellings of Native Americans. These features sometimes appear alone, sometimes in groups, and sometimes they appear to overlap. Observers many hundreds of miles apart have on occasion observed the same TeePee events. So what causes TeePees? Based on its unique shape and on fine details observed in some of the events, Dr. Fung proposes that these TeePees might be the result of remote lightning strikes reflecting off the Earth's ionosphere. Examples of these data and his interpretation were presented in a poster session at the AGU and were well received by the attendees. Dr. Fung reports that several people stopped by to discuss these results with some of these discussions possibly leading to follow-up opportunities for collaboration. We look forward to reporting more on this research in a future issue.
1Propagation TeePee: A High Frequency (HF) Radio
Spectral Feature Identified by Citizen Scientists
Shing F. Fung, David Typinski, Richard Flagg, Thomas Ashcraft, Wes Greenman, Charles Higgins, James Brown, Larry Dodd, Andrew S. Mount, Francisco Reyes, Jim Sky, James Thieman and Leonard Garcia
Rebecca Beamer and Quinn Wilson, undergraduates studying physics and astronomy, are working with Dr. Chuck Higgins of MTSU in tandem with the Radio JOVE citizen science project. According to NASA, citizen science is defined as “a form of open collaboration in which individuals or organizations participate voluntarily in the scientific process in various ways” (Science Mission Directorate Policy Document SPD-33, https://science.nasa.gov/citizenscience). Radio JOVE is a part of the NASA Space Science Education Consortium (NSSEC) to pursue scientific research, and to develop and promote citizen science through collaborations with other scientists and the public.
To facilitate this, Radio JOVE has been collecting solar radio data for many years and we need help from citizen scientists to reduce and analyze it. We are using a Zooniverse web platform (zooniverse.org) to create a citizen science project where participants identify and count low frequency solar radio bursts as a way to measure solar variability. We will assemble these counts into a solar radio burst monthly count number to resemble a sunspot number.
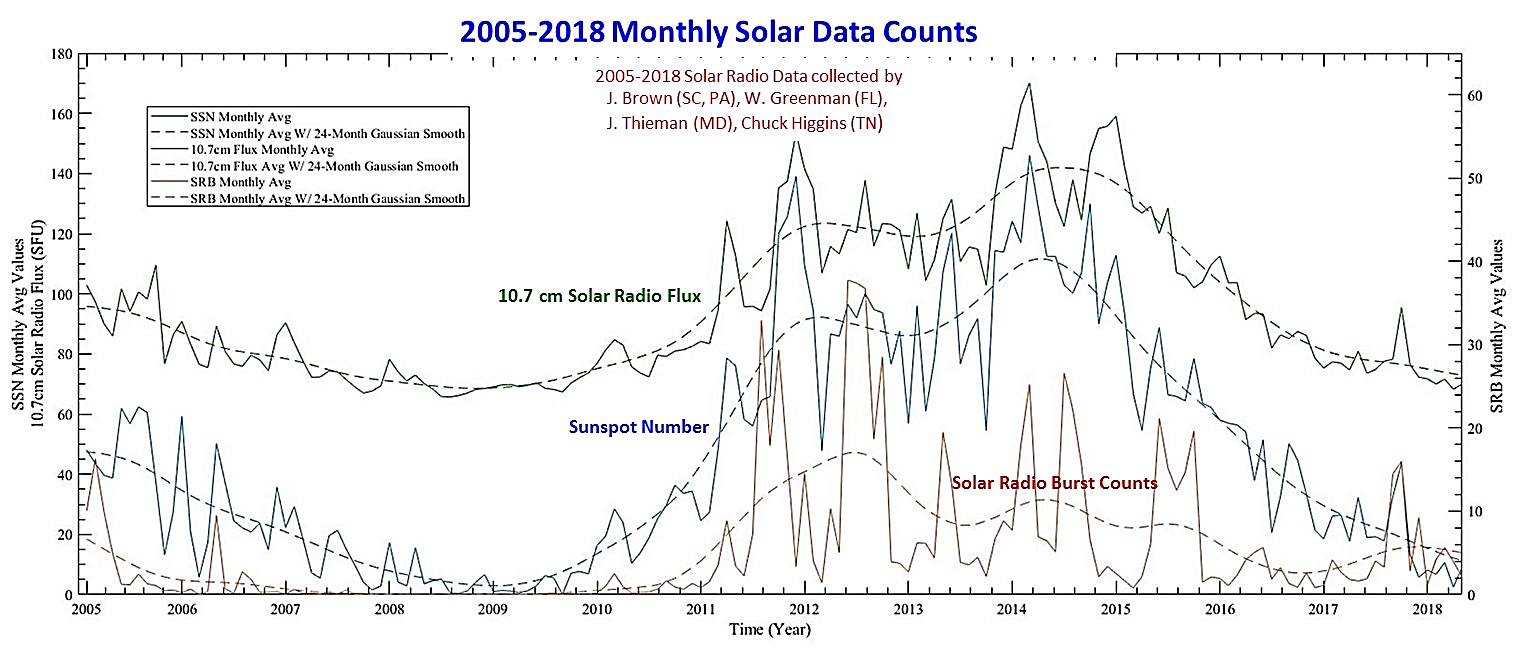
The Sun goes through a well-known sunspot cycle with a period of about 11 years. Ultimately, this is a 22-year magnetic cycle caused by magnetic reversals of the global magnetic field. Scientists still do not fully understand why this process happens. One method to measure the solar activity is the sunspot number, but the sunspot number can vary quite substantially over days and weeks. Therefore, scientists typically plot a monthly average to show long-term variations (Figure 1). Another method to measure solar activity is the 10.7 cm (2800 MHz) radio flux density measurements made since the late 1940s. While the sunspot number indicates magnetic activity in the photosphere, the 10.7 cm radio data indicate thermal processes in the upper chromosphere and at the bottom of the corona.
What about Radio JOVE data at 20 MHz? Simply put, these lower frequency radio emissions come from non-thermal emission generated in the corona about one solar radii from the Sun. The low frequency radio bursts are a result of solar flares and coronal mass ejections because these events move large amounts of plasma away from the Sun. The ejected plasma carries magnetic fields with it; therefore, free electrons are able to spiral around the field lines and cause radio emissions. Because solar flares, prominences, and coronal mass ejections occur more frequently during times when sunspot activity is high, a simple count of radio bursts is a measure of solar activity. We are interested in studying the long-term variations in the low frequency solar radio emission.
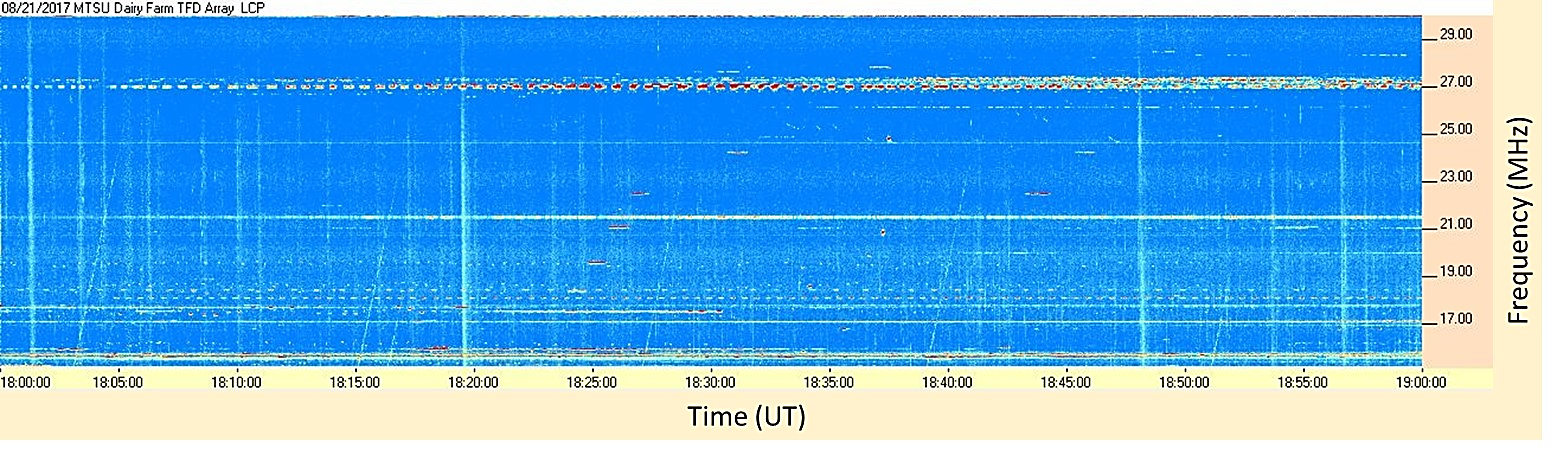
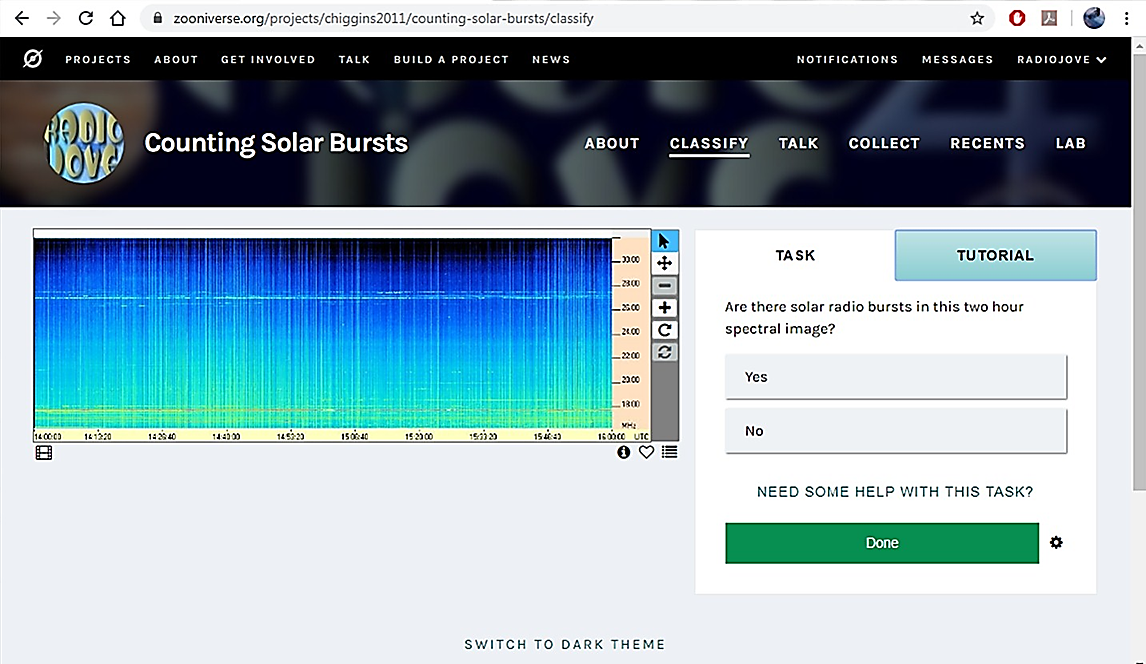
The actual process for counting solar bursts for an entire month is tedious and time-consuming for a single researcher, let alone a year, so we are asking citizen scientists to help us analyze the data and reduce the overall time required for analysis. Soon we will be releasing a project on Zooniverse, where you will be able to analyze colored spectral plots and count the number of solar bursts in a 2-hour interval “snapshot” (Figure 2). Each day in a month has five of these 2-hour spectrographic “snapshots,” and there are about seven months’ worth of data available to you to analyze (Figure 3). Anyone can do it, so long as you have a link to the project. Don't worry if you aren't sure how to count the solar bursts, there is a tutorial available to help you on the project’s classification page. The tutorial also explains how to distinguish solar events from interference (power lines, radio stations, etc.). Analyzing a day’s worth of data takes only a few minutes, so it won't take a lot of time.
We are currently beta testing with a select number of professors and students at our university, but soon the project will become live and public for you to analyze. After receiving feedback from participants, we will then submit our project to Zooniverse for official review.
Zooniverse has a bevy of citizen science projects available under their projects tab (https://www.zooniverse.org/projects). If you are strictly interested in galaxies, look into Galaxy Zoo: Mobile, a citizen science project where participants are asked to categorize galaxies according to their shapes. If you are interested in some of NASA’s citizen science projects, you may want to look into COSMIC, Planet Hunters TESS, Gravity Spy, and many others. Check https://science.nasa.gov/citizenscience for more citizen science projects in conjunction with NASA.
The Radio JOVE project has been in operation for over 20 years and during most of that time the main components of the website (https://radiojove.gsfc.nasa.gov) have remained the same. We are now in the process of renovating the website and we ask for your help in doing so.
Whether you have used the website a lot or a little your input will still be valuable to renovation. We are interested in hearing both the bad and the good about the website and what things you think are in need of change. So, for example, our questions to you might be:
I'm sure there are a number of other questions that might be listed.
Please send your responses to me at jt1203@aol.com Any feedback is appreciated even if it is only one pet peeve. Thanks for your contribution.
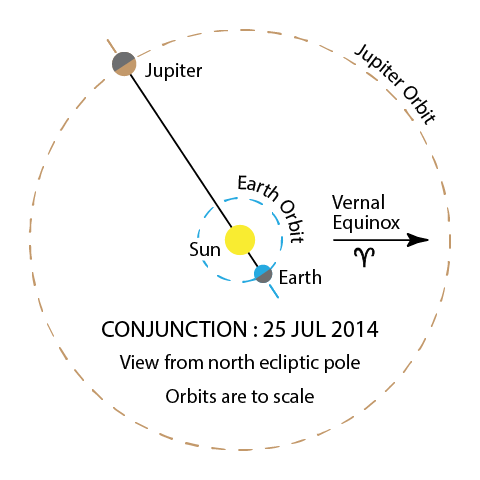
Since decameter-wavelength radio emissions from Jupiter were first discovered in the mid-fifties, thousands of hours of radio observation of the planet have shown that the more difficult times to receive Jupiter emission are generally when Jupiter is near conjunction with the sun. (see Figure 1). Near conjunction, both Jupiter and the sun are close together in the sky.
When the sun is active, as it is near solar maximum, the earth’s ionosphere is heavily ionized during daylight hours (due to solar UV and X-ray emissions). The ionosphere is then opaque to Jovian signals from shortly after sunrise to a few hours after sunset. When the ionosphere is opaque to Jovian signals from above, it is also a good reflector for terrestrial radio signals, making for difficult listening conditions.
During solar minimum the ionosphere can remain transparent for Jovian signals during daylight hours. Although the ionosphere will be transparent and allow Jovian signals through when Jupiter and the sun are close together in the sky, those signals will generally be weaker when Jupiter is at its maximum distance from earth at conjunction compared to when Jupiter is at opposition.
Near solar minimum observers are encouraged to listen during daytime as well as nighttime hours. Listening when Jupiter appears close to the sun will allow us to observe how Jovian signals are affected as they propagate through the solar corona.
As we move toward solar maximum in the upcoming years, daytime listening conditions will worsen and the best Jovian observing times will only include the nighttime hours when Jupiter is far from the sun.
Sometimes we refer to “a Jupiter observing season.” At solar maximum the season is only several months long when Jupiter and the sun are far apart in the sky. At solar minimum the season can be almost the whole year long as reception is possible even when the sun and Jupiter are close together in the sky (see Figure 2).
Now is the time to take advantage of solar minimum conditions. Don’t just listen late at night for Jupiter, but take advantage of good daytime listening conditions also.
The JOVE Bulletin is published twice a year. It is a free service of the Radio JOVE Project. We hope you will find it of value. Back issues are available on the Radio JOVE Project Web site, http://radiojove.gsfc.nasa.gov/
For assistance or information send inquiries to:
or
