INTRO
 |
BUILDING THE TELESCOPE
SOFTWARE
 | 
OBSERVING
 |
DATA ANALYSIS


Radio Telescope – Data Analysis

After setting up the Radio JOVE 2.0 receiver and the antenna system successfully, you are now ready to make radio observations and take data. We hope your setup is at a radio-quiet location where it is relatively free of radio frequency interference (RFI). We must recognize, however, that neither the antenna nor the radio receiver system has the capability to distinguish whether the detected signals are coming from Jupiter, the Sun, the Galactic radio background, or from radio stations or other local interference like fluorescent lights, a lawnmower, or a heat pump/air conditioner.

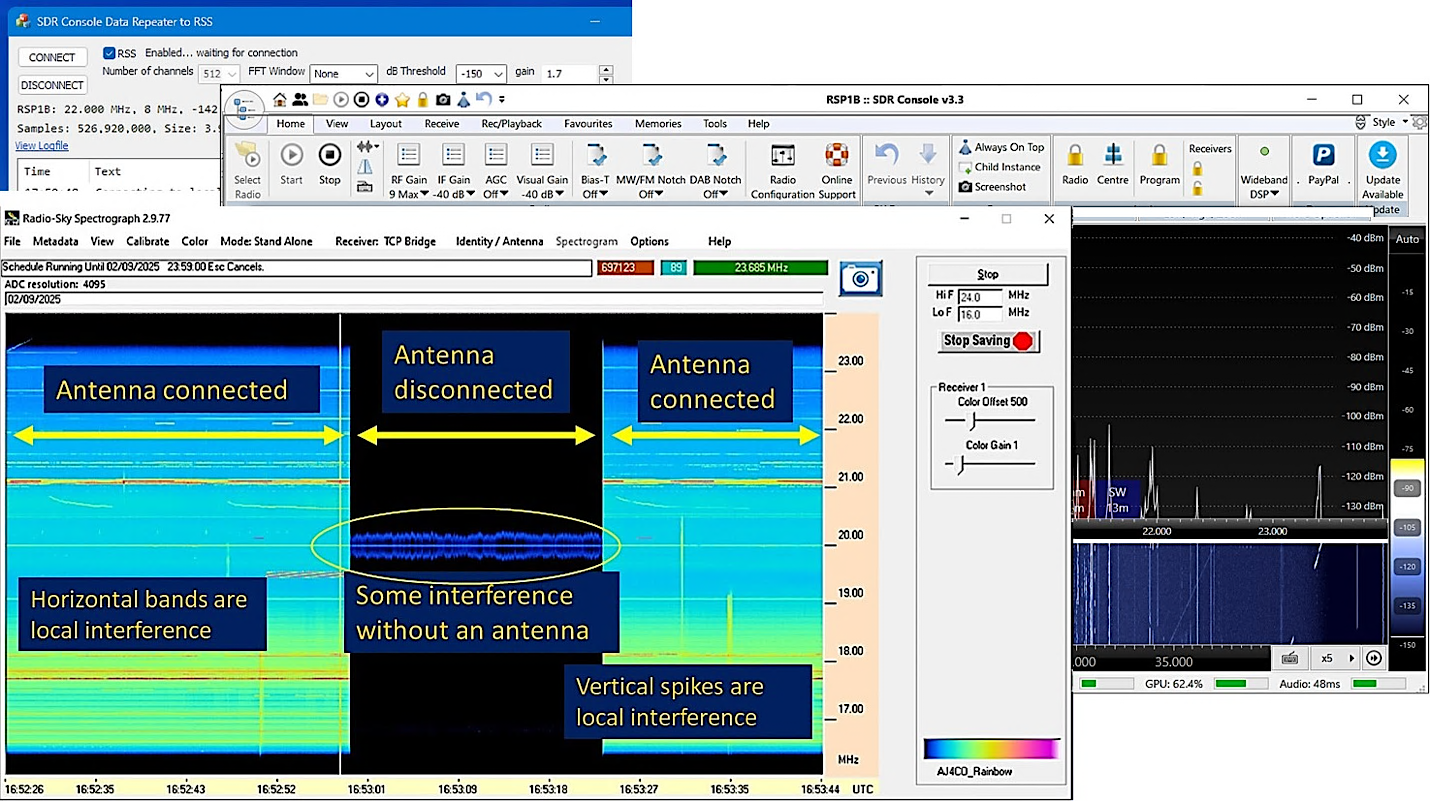
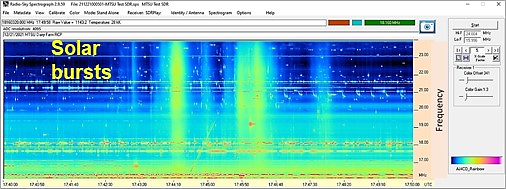
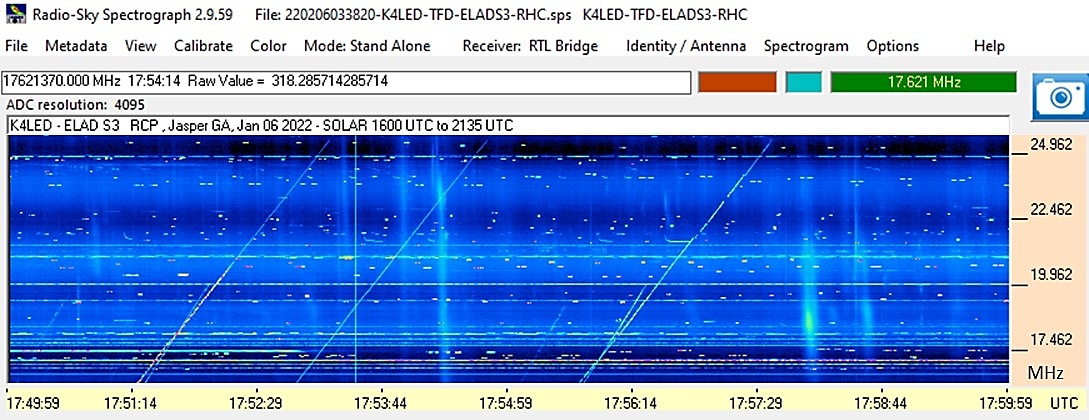
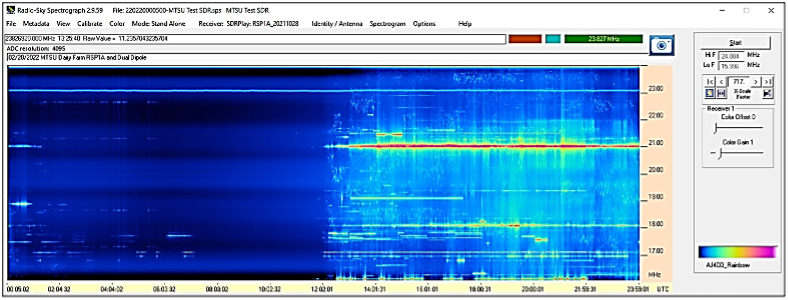
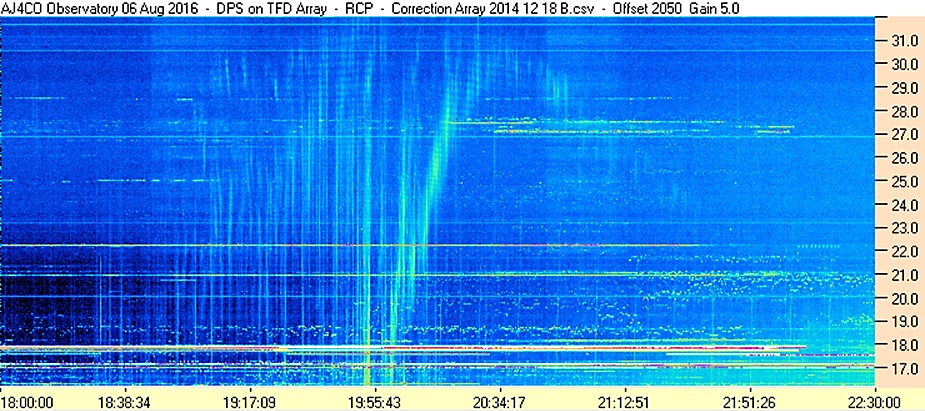
With practice you will be able to recognize many types of astronomical signals in your spectrograph data compared with terrestrial interference. Below are a few examples of spectrographs.

RSS display software of RJ spectrograph output
Example Radio JOVE spectrograph output using RSS display software. Note the large increase in signal denoted by the colored background after the antenna is connected. Horizontal bands are local interference, some very strong near 18 MHz. A solar burst is seen at the center as the near-vertical "wispy" band. (C. Higgins, 2022)
No data spectral display
A Radio JOVE spectrograph showing no data (black background) and bad interference (horizontal and sharp vertical bands). (C. Higgins, 2022)
Display showing multiple solar bursts vs. frequency
A Radio JOVE spectrograph showing multiple solar bursts as the near-vertical “wispy” bands. Spotty interference occurs at several frequencies, with more interference below about 18 MHz. A positively sloped “sweeper” radar signal is seen near the center of the spectrograph. (C. Higgins, 2021)
more solar bursts
An SDR spectrograph showing several solar bursts as the near-vertical “wispy” bands. Several positively sloped “sweeper” radar signals are seen. (L. Dodd, 2022)
24 hour long spectrogram
Example 24-hour Radio JOVE spectrograph output using RSS display software. Note the clear difference in the nighttime observations on the left and the daytime observations on the right. Local interference is more prevalent during the daytime. (C. Higgins, 2022)
Spectral display of Io-B decametric emissions
A 4.5-hour wide band spectrograph from 16 – 32 MHz showing an excellent Jupiter Io-B emission event (D. Typinski, 2016).

Please check back here periodically for more examples of spectral features and for more information on spectrograph data processing.

For an excellent summary of data reduction techniques with the original Radio JOVE RJ1.1 receiver, see the material on this web page:
https://radiojove.gsfc.nasa.gov/radio_telescope/rj1.1/rj1.1_data_analysis.php

GIF of plots from AJ4CO
spectral display