RJ 2.1 Radio Telescope – Building & Testing
The Radio JOVE 2.1 radio telescope is comprised of a wideband receiver and an antenna that operates over an 8 MHz (MegaHertz) span of shortwave frequencies centered on 20 MHz. The receiver is a commercially available RSP1B Software Defined Radio (SDR) from SDRplay (www.sdrplay.com), a UK-based company that manufactures SDR radios. Because this radio does not require construction, no tools are needed. You set up the receiver by simply attaching cables and downloading and installing radio control software.
You will construct the dual dipole antenna, requiring a soldering iron, solder, and basic tools for stripping the wires, installing the connectors, and constructing the antenna support masts. A professionally built antenna is an optional purchase that comes with all connectors installed. However, basic tools will be needed for constructing the antenna's support mast. A coaxial transmission line carries the radio signals from the antenna to the receiver, and a USB cable carries the radio signals from the SDR to the computer and the display software.
Fabrication of the radio telescope is covered in detail in the receiver and antenna construction manuals. The receiver setup and operation manual guides you through the software download and startup and the connections to your computer. If you have difficulties the Radio JOVE staff are available to help.
Download the Radio JOVE 2.1 Telescope Manuals
Testing the Radio JOVE 2.1 radio telescope
Testing the Receiver and Antenna Together
Before making your first observations it is a good idea to set up the antenna and receiver to confirm that everything is working properly. For this test you can set up either a single dipole or the dual dipole array. Note—do not do any testing of the receiver and antenna if there is nearby lightning.
We recommend two different levels of testing:
- Basic Test: Connect the antenna to the receiver and the receiver to the computer to look for an increase in background noise.
- Second Test: Compare your data with Example Spectrograms.
1. Basic test (Antenna and receiver)
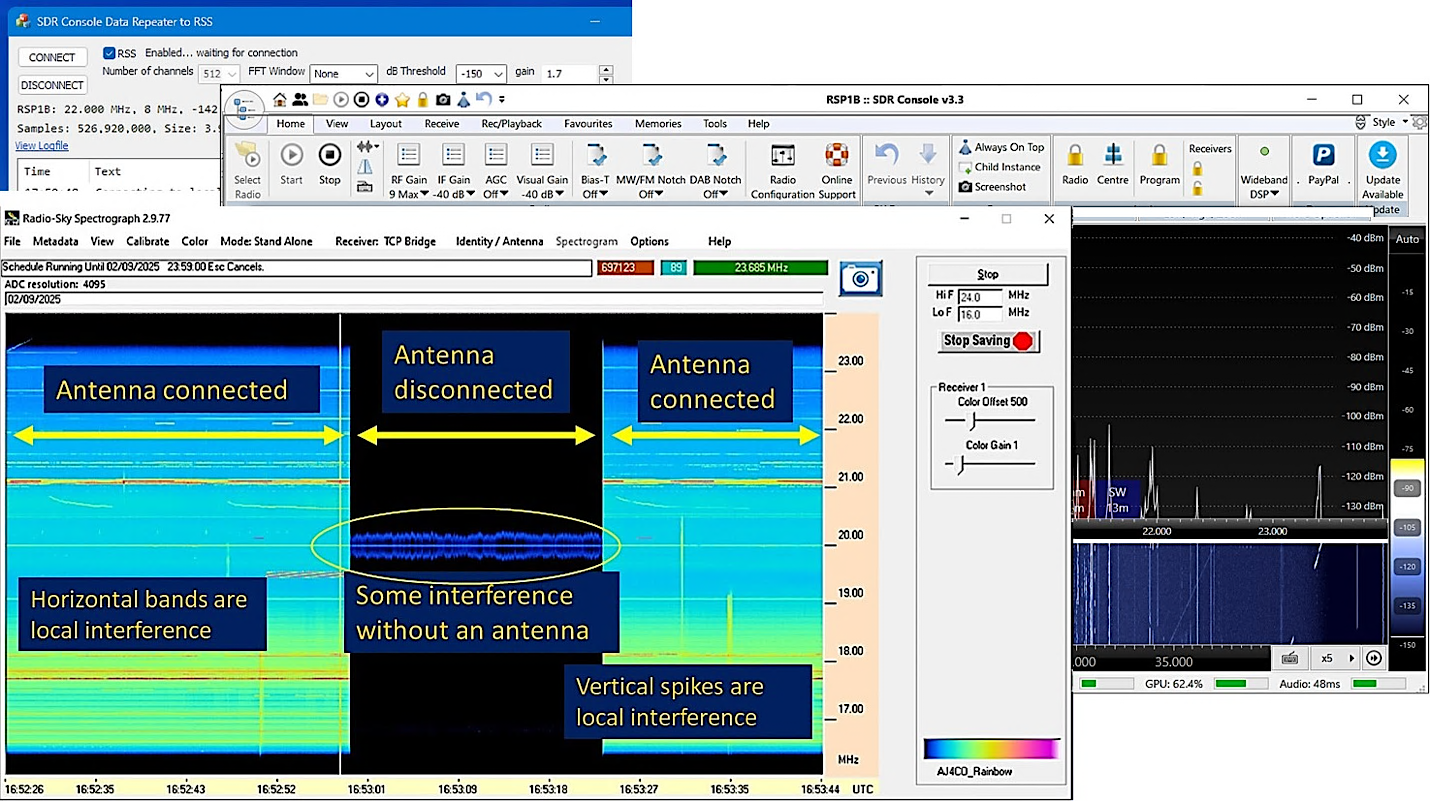
The simplest test is to disconnect and reconnect your antenna while the software is running.
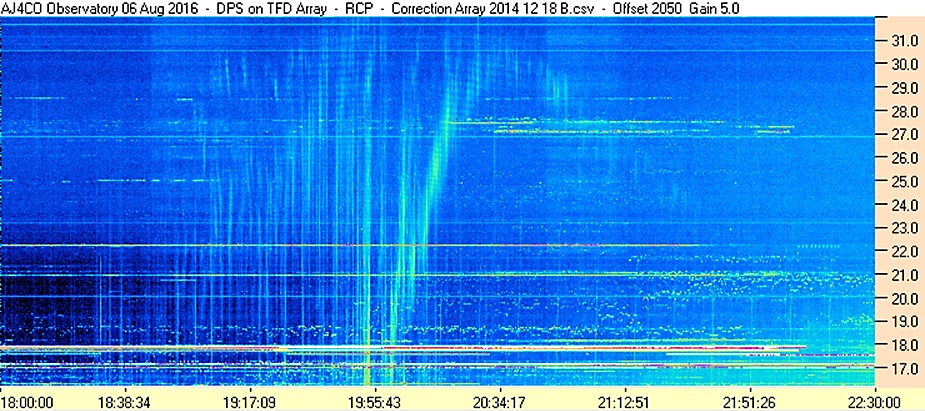
- Disconnect your antenna -With the software running disconnect your antenna from the SDRplay receiver. The spectrograph will go nearly black (see figure below). You might see some small interference on your chart without an antenna connected.
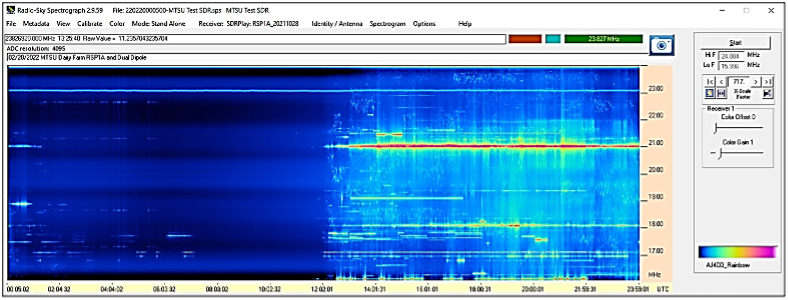
- Connect your antenna -you should see a good color spectrogram like the figures below. It shows many horizontal bands of interference and a particularly strong one near 18 MHz. Some horizontal banding is normal. The second figure shows a 24-hour spectrogram showing the much quieter background during the local nighttime.
With the antenna connected you should see a large increase in signal denoted by the colored background after the antenna is connected. This is the galactic background radiation caused by relativistic electrons spiraling in our galactic magnetic field. You may also see additional signals due to terrestrial sources, typically seen as horizontal bands on the spectrogram. At night you will see a more constant background noise level with fewer stations.
If there is no change in the background when the antenna is connected, check the connections and connectors between the antenna and receiver. If you do not see a significant increase in the background either the software is not set up correctly or the receiver is not working properly.
2. Second Test: Compare your data with Example Spectrograms
If you have not already done so, follow the download and software setup instructions in the Radio JOVE 2.1 receiver manual. After you have your software running compare your output to some of the examples below.
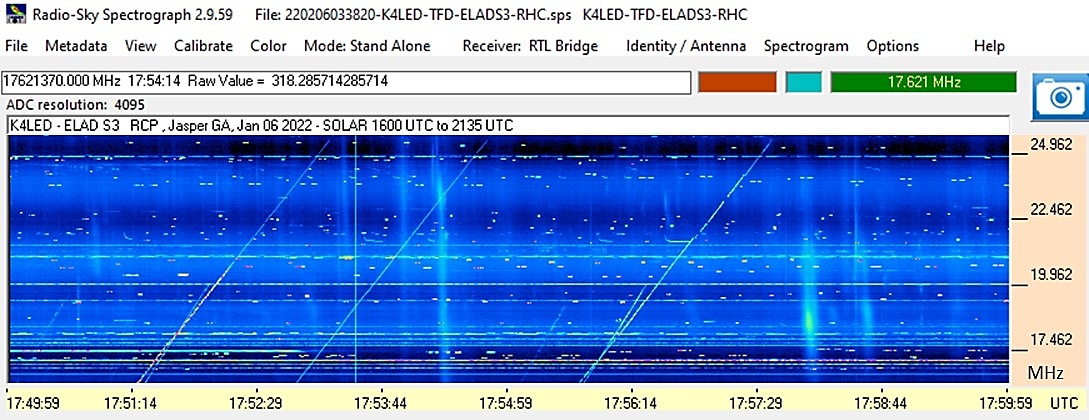
- Radar sweeps - A spectrogram of the ionospheric “sweepers” caused by distant radar used to sound the ionosphere. These appear as diagonal lines on spectrograph graphs from low frequency to high frequency and are a good sign you are picking up distant radio signals. The spectrogram above shows 3-4 sweepers and several solar bursts.
- Interference – horizontal bands are local interference local radio stations or from electrical sources like power lines, lights, and HVAC systems. See the 24-hour spectrum above showing the difference between nighttime and daytime interference. The conditions are mostly quiet at night, but there is more electrical noise during the day, and the ionosphere reflects more radio signals during the daytime. The strong horizontal bands are local broadcast radio stations.
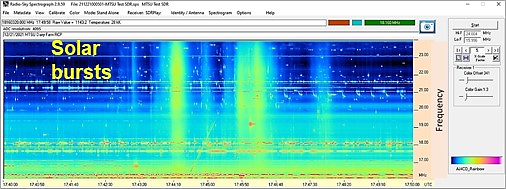
- Solar bursts show as broadband (near vertical) “wispy” signals on the spectrograms in the spectrum below.
- Jupiter bursts show as broadband bursts signals sometimes drifting upward or downward on the spectrograms. The signals are generally weaker than solar bursts but usually show more spectral structure.
Soldering Techniques
Use only the recommended soldering iron (25-30 watts), preferably temperature regulated with a small tip. Keep a wet sponge near the soldering iron. KEEP YOUR SOLDERING IRON TIP CLEAN! When it gets dirty (black crud on tip), wipe the tip on the sponge.
When you solder, place the iron-tip in contact with the wire /component AND in contact with the printed circuit board (contact both at the same time). Another tip: to get the solder to start flowing after cleaning the tip, quickly melt a drop or two of solder onto the tip (called "tinning the tip") and then immediately apply the tip to the board/wire, heat both up and apply solder to the joint.
When solder flows smoothly and covers the joint remove the iron. The solder joint should be shiny, not gray and dull (a cold solder joint). This process should not take more than 5 seconds from grabbing the iron to putting it back in the holder. If you apply too much heat to the joint, the heat may damage a component.
You might practice soldering on an old PC board (preferably with holes in it). Try soldering scrap pieces of resistor leads to a terminal on the board until the connections look good. That way you can get a feel for how much heat is needed to get a good solder flow in a minimum period of time.
Recapping the soldering procedure:
- Wipe the tip on the sponge.
- "Tin" the tip with solder.
- Apply the tip to both the connector and wire
- Add solder to the joint (let the solder touch the connector and tip)
- Let the solder flow for a second or two.
- Replace soldering iron. The new solder joint should be shiny (not dull).
View this how-to video on soldering: 